Regressions are used to establish a mathematical relationship between two variables x and y. Both statistics and machine learning fundamentals are concerned with how to explain the variable y using one or more variables x. Here are a few examples:
- What influence does the learning time (=x) have on the exam grade (=y)?
- How is the use of plant fertilizer (=x) related to the actual harvest (=y)?
- How does the crime rate in a city (=y) change depending on the number of police officers in the city (=x)?
The variable y to be explained is called dependent variable, criterion or regressand.
The explanatory variable x, on the other hand, is the so-called independent variable, predictor or regressor.
The goal of linear regression is to formulate a mathematical relationship that describes the influence of x on y also in numbers:
\(\) \[y = β_0 + β_1x + u \]
- β0: Intersection with the y-axis, e.g. the exam grade that would be achieved without studying.
- β1: Increase of the regression line, e.g. the influence that an additional hour of studying has on the exam grade.
- u: Error term, e.g. all influences that have an effect on the exam grade but are not captured by the learning time, e.g. prior knowledge.
- y: Variable, which one would like to predict with the help of linear regression.
- x: Variable that is used as the basis of the prediction and has an effect on y.
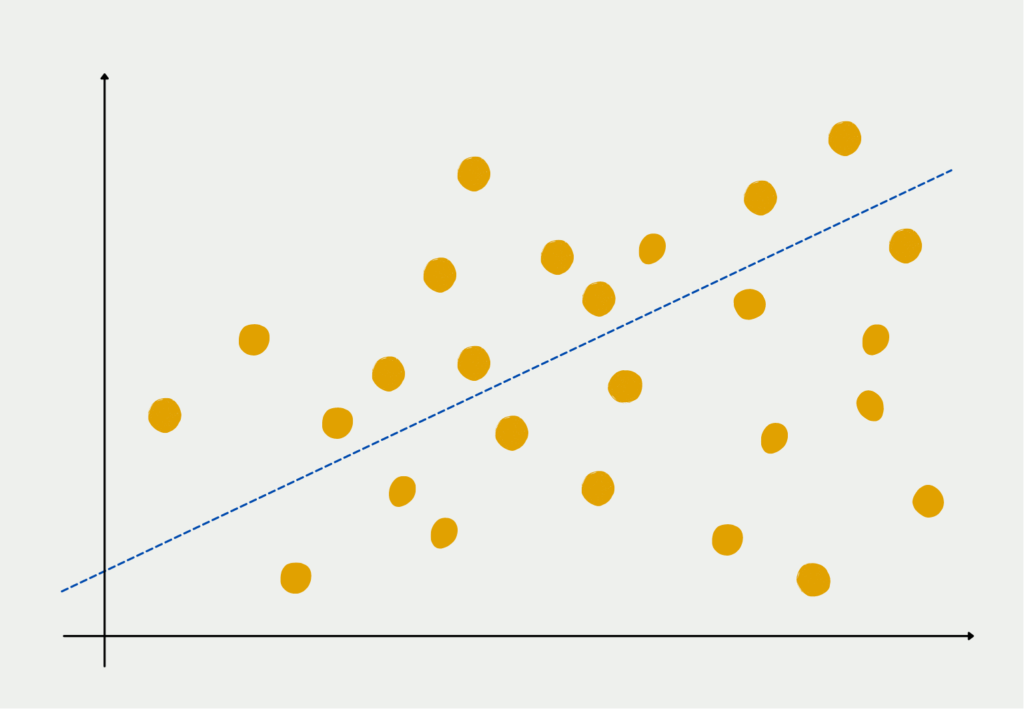
Figuratively speaking, this means that we try to find the straight line through the point cloud of data sets that has the smallest distance to all points.
How to interpret the regression equation?
Suppose we get the following regression equation for the exam preparation example:
\(\) \[y = 5.0 – 0.2x + u\]
In this case, the y-axis intercept (β0) is 5.0, which means that without studying, the students are likely to complete the exam with a grade of 5.0. Since the prior knowledge or leftover knowledge from the course is represented in the error term.
The regression weight (β1) in this case is -0.2, so for every hour spent studying for the subject, the exam grade becomes 0.2 grades better. Thus, with 5 hours of study, the student’s expected grade would be 1.0 better compared to the case where no study was done.
Overall, according to this regression, students could expect a final grade of 3.0 after 10h of learning. At the same time, they can read that they should study at least 5h to pass.
Which assumptions need to be met?
Linear regression is a statistical method that models the relationship between a dependent variable and one or more independent variables. The assumptions of linear regression are:
- Linearity: The relationship between the independent and dependent variables should be linear. This means that as the value of the independent variable changes, the value of the dependent variable changes proportionally.
- Independence: The observations in the dataset should be independent of each other. In other words, the value of one observation should not be influenced by the value of another observation.
- Homoscedasticity: The variance of the errors or residuals should be constant across all levels of the independent variable. This means that the spread of the residuals should be the same for all values of the independent variable.
- Normality: The errors or residuals should follow a normal distribution. This means that the majority of the residuals should be close to zero, and the number of residuals that are far away from zero should decrease as you move away from zero.
- No multicollinearity: The independent variables should not be highly correlated with each other. Multicollinearity can cause issues with the interpretation of the regression coefficients and can lead to unstable and unreliable models.
- No outliers: Outliers are observations that are significantly different from the other observations in the dataset. Outliers can affect the regression line and can lead to inaccurate predictions.
It is important to check these assumptions before using linear regression to make predictions. Violations of these assumptions can lead to biased estimates and inaccurate predictions.
What is the Error Term?
In our previous remarks, we did not go into the error term u in more detail, although it has a crucial meaning for the interpretation of the regression. If we use only one or two independent variables for a regression, this will not be sufficient in many cases to represent all influencing factors on the dependent variable y. Of course, it is not only the number of hours studied that determines the final exam grade. There are several other factors that play a role, e.g. the handling of stressful situations or the number of lectures attended.
This circumstance is not bad for the time being, since we only select the independent variables that are of interest for our evaluation. In our example, we only want to make an explicit statement about the relationship between learning and the exam grade. Therefore, we do not need to explicitly list the number of attended lectures as a variable but can leave it as one of many in the error constant.
However, it becomes critical when the independent variable “learning hours” correlates with a factor (see Correlation and Causation) that is still hidden in the error constant. Then the regression factor (β1) is not correct and we make a mistake in the interpretation.
Suppose we want to determine how the level of education affects the wage per hour. To do this, we use education in years as the independent variable x and current hourly wage as the dependent variable y:
\(\) \[\text{Hourly Wage} = β_0 + β_1 \cdot \text{(Eduction in Years)} + u \]
The error term in this example would be factors such as seniority, number of promotions, or general intelligence. In this case, problems may arise if we use this equation to interpret β1 as the impact that an additional year of education has on hourly wages. Indeed, the intelligence factor is most likely positively correlated with the education variable. A person with a higher intelligence quotient is also very likely to have a higher education degree and thus to have spent more years in school or at university.
Which applications use the linear regression?
Linear regression is a popular statistical method used for modeling the relationship between a dependent variable and one or more independent variables. The technique is widely used across a range of fields and industries and has numerous applications in both research and business contexts.
One of the most common applications of linear regression is in the field of economics. Economic models often use linear regression to estimate the relationship between two or more economic variables, such as income and spending or unemployment and inflation. This allows economists to make predictions about future economic trends and develop policies to address economic issues.
Linear regression is also commonly used in the field of finance. For example, it can be used to model the relationship between stock prices and various economic indicators, or to analyze the risk and return of different investment portfolios.
In the field of marketing, linear regression can be used to model the relationship between a company’s marketing spend and its sales revenue. This allows businesses to optimize their marketing strategies and allocate resources more effectively.
Linear regression is also widely used in the field of health sciences, particularly in medical research. For example, it can be used to analyze the relationship between a particular disease and various risk factors, such as age, gender, and lifestyle factors. This allows researchers to identify potential causes of disease and develop strategies for prevention and treatment.
In the field of social sciences, linear regression is commonly used to analyze the relationship between various social and behavioral variables, such as education, income, and health outcomes. This allows researchers to better understand social and economic disparities and develop policies to address them.
Overall, linear regression is a versatile and widely applicable statistical technique that can be used to model and analyze relationships between variables in a variety of fields and contexts. Its flexibility and simplicity make it a popular choice for both researchers and business analysts.
What are the limitations of a linear regression?
Linear regression has several limitations, including:
- Linear relationships only: Linear regression assumes that the relationship between the dependent and independent variables is linear. This means that if the relationship is non-linear, the model may not fit the data well.
- Sensitivity to outliers: Linear regression is sensitive to outliers, which are data points that deviate significantly from the rest of the data. Outliers can have a large impact on the slope and intercept of the line, which can lead to inaccurate predictions.
- Multicollinearity: Linear regression assumes that the independent variables are not highly correlated with each other. If there is multicollinearity, where two or more independent variables are highly correlated, the model may not be able to distinguish the separate effects of each variable.
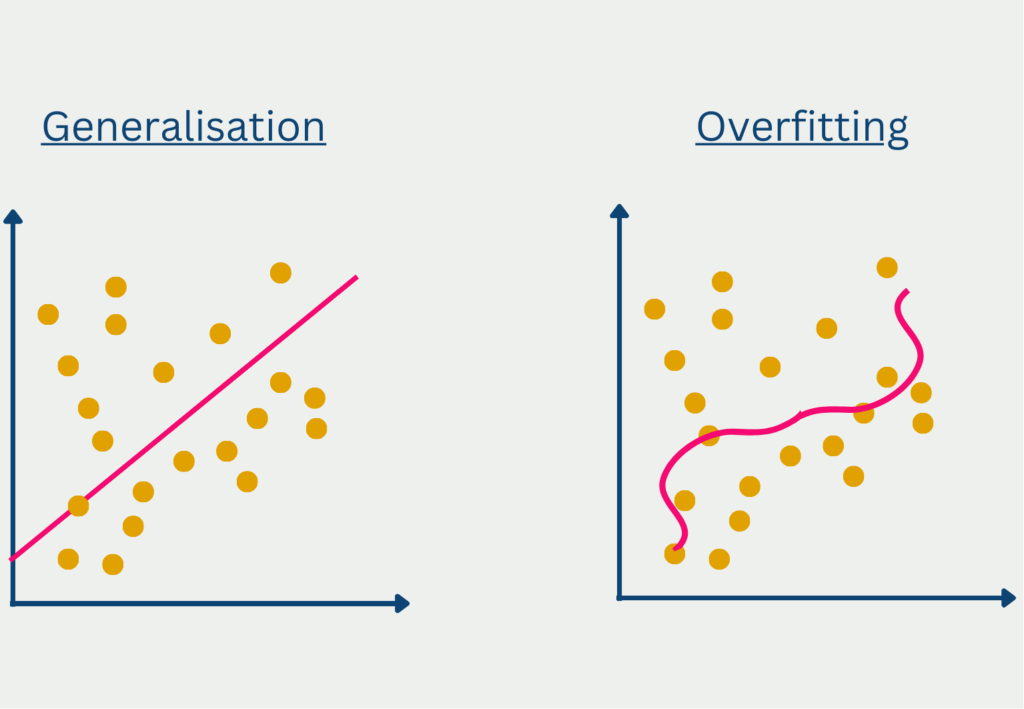
- Overfitting or underfitting: If the model is too complex, it may overfit the data, meaning it fits the noise in the data rather than the underlying pattern. If the model is too simple, it may underfit the data, meaning it misses important relationships between the variables.
- Assumption of independence: Linear regression assumes that the observations are independent of each other. If the observations are not independent, such as in time series data, the model may not be appropriate.
It is important to keep these limitations in mind when using linear regression and to evaluate the model’s performance carefully to ensure that it is appropriate for the specific data and problem at hand.
This is what you should take with you
- Linear regression is a special case of regression analysis.
- It attempts to find a linear function that describes how the independent variable x influences the dependent variable y.

What is a Boltzmann Machine?
Unlocking the Power of Boltzmann Machines: From Theory to Applications in Deep Learning. Explore their role in AI.

What is the Gini Impurity?
Explore Gini impurity: A crucial metric shaping decision trees in machine learning.

What is the Hessian Matrix?
Explore the Hessian matrix: its math, applications in optimization & machine learning, and real-world significance.

What is Early Stopping?
Master the art of Early Stopping: Prevent overfitting, save resources, and optimize your machine learning models.

What is RMSprop?
Master RMSprop optimization for neural networks. Explore RMSprop, math, applications, and hyperparameters in deep learning.

What is the Conjugate Gradient?
Explore Conjugate Gradient: Algorithm Description, Variants, Applications and Limitations.
Other Articles on the Topic of Linear Regression
- The mathematical basics are described here in more detail than in our article.

Niklas Lang
I have been working as a machine learning engineer and software developer since 2020 and am passionate about the world of data, algorithms and software development. In addition to my work in the field, I teach at several German universities, including the IU International University of Applied Sciences and the Baden-Württemberg Cooperative State University, in the fields of data science, mathematics and business analytics.
My goal is to present complex topics such as statistics and machine learning in a way that makes them not only understandable, but also exciting and tangible. I combine practical experience from industry with sound theoretical foundations to prepare my students in the best possible way for the challenges of the data world.