TensorBoard is a visualization tool that can be used for the Machine Learning workflow, for example, to plot the increase in accuracy of a model across training epochs. Functionalities include visualization of metrics, such as accuracy or loss, as well as model structure, such as the layers of a neural network.
What does TensorBoard offer?
TensorBoard gives Machine Learning engineers the ability to better understand their experiments and observe the models in training to draw conclusions that ultimately improve the performance of the model. This includes, for example, evaluations to adjust the model’s hyperparameters.
In addition, TensorBoard also offers the possibility to interactively share the results of the training and to work on a project in a team. This is made possible by the fact that the dashboard can be deployed on a website and thus made accessible to several people at the same time.
In addition, the evaluations and diagrams can also be used simply for illustration purposes, providing you with interactive and ready-designed dashboards without much programming effort, which you can integrate into your own research work or a presentation, for example.
How to use TensorBoard in model training?
TensorBoard can be used relatively easily in the Python programming language. To do this, the following commands must be called.
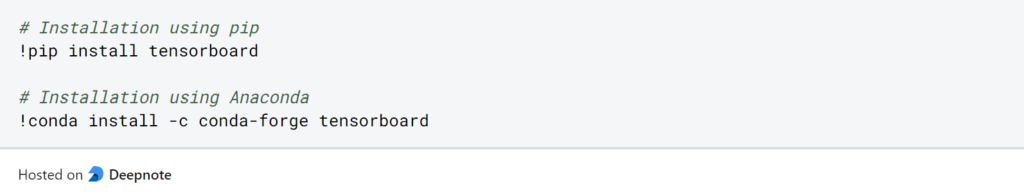
Installation
The following commands can be used to install the library, depending on whether you use Anaconda or pip for the installation:
Use of TensorBoard in Jupyter Notebooks
If you want to use TensorBoard in a Jupyter Notebook or Google Colab, you can do the previous installation normally and then you have to call the Notebook Extension additionally. This is done with the following command:

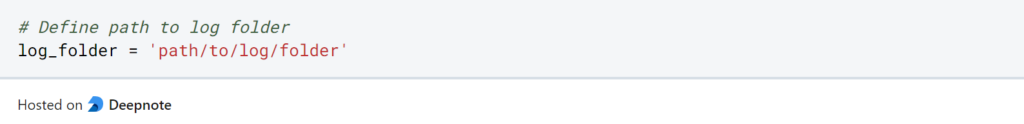
The data for the creation of diagrams and visualizations are stored in a so-called log folder. If you are using the program for the first time, you can create such a folder and specify the path to the folder using the “log_folder” variable:
If you want to train a new model, it is always a good idea to empty the log folder once, so that you do not overwrite old results and the information gets mixed up.

Now the setup is set up so that you can start with the model training.
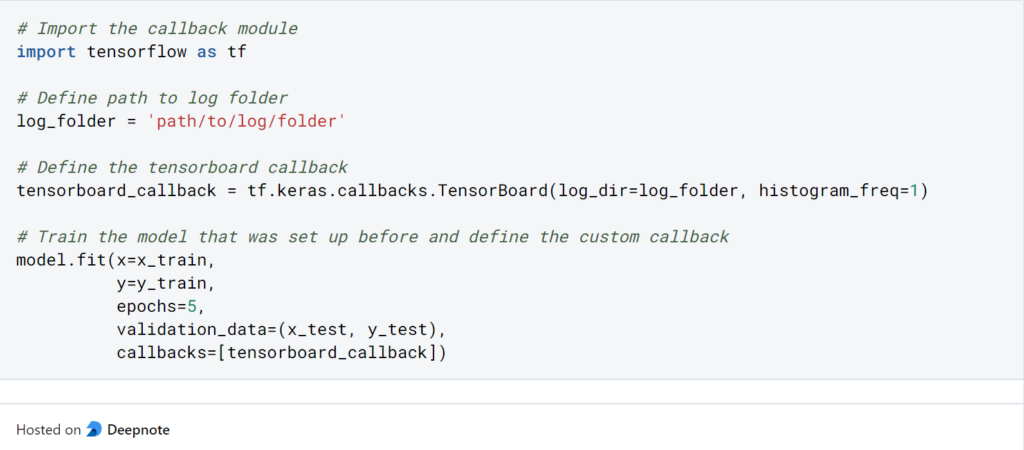
Set up callbacks
The model structure can be designed exactly as it is already known in TensorFlow. This means that by using TensorBoard nothing changes in the programming of the model. Rather, you define a so-called callback, which defines which data should be passed to TensorBoard and where the corresponding log files are stored. This callback is then passed as a parameter to the command “model.fit()” and can then observe the diagrams during training.
Call Dashboard
The corresponding dashboard can then be called up using the following command in the notebook. If you do not use the notebook variant, the command is the same, but without the percentage sign:

The dashboard then opens via the localhost and is also updated after each epoch during model training.
When can you use TensorBoard?
TensorBoard is, as the name suggests, a development of Google and its Machine Learning platform TensorFlow. This is another reason why the integration of models built in TensorFlow or Keras is the easiest. Nevertheless, TensorBoard can also be used in other Machine Learning frameworks.
For PyTorch for example there is also the possibility to use the visualization tool. For this, a so-called “SummaryWriter” must be initialized, into which the events are written.
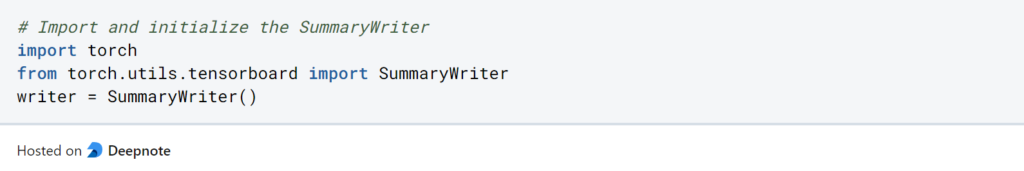
All desired events are written into this Writer during the training and can then be displayed on TensorBoard.
What are the visualization options?
TensorBoard offers different types of dashboards that can be tracked during the training of a Machine Learning model. With each epoch, the charts update automatically and it is thus also possible to display the temporal progression of the training. In general, the following dashboard types are distinguished:
- Scalar Dashboard: In these charts, individual scalars and their change over time can be observed. The most common scalars include loss, accuracy, or learning rate.
- Histogram Dashboard: The histogram shows the historical distribution of a tensor. Each piece is the tensor at a certain point in time.
- Distribution Dashboard: The distribution chart is very similar to the histograms with the difference that it does not show the historical distribution but how statistical values have changed. This can be used, for example, to show how the median has changed over the eras.
- Graph Explorer: The Graph Explorer can be used to visualize the structure of the model and to check whether the architecture has been programmed correctly. The representation can also be created without TensorBoard using “model.summary()”.
- Embedding Projector: With the help of this representation the data can be visualized in different embedding levels. For example, you can follow the embedding of the input data after it has passed through the first dense layer in a neural network.
What are the benefits of using Tensorboard?
TensorBoard offers a multitude of benefits that streamline the machine learning development process, enhance model understanding, and contribute to improved performance. Its versatile features bring a new level of clarity and efficiency to various aspects of model visualization, monitoring, and debugging.
One of the primary advantages of TensorBoard is its ability to simplify the complex. It translates intricate machine learning concepts into intuitive visualizations that help data scientists, researchers, and developers comprehend the inner workings of their models. From graph visualizations that reveal the structure of your computations to embeddings that map high-dimensional data into manageable clusters, TensorBoard’s graphical representations provide insight into what is often abstract and intricate.
Monitoring training progress is another key benefit. The Scalars dashboard allows for real-time visualization of metrics such as loss and accuracy, helping you track model performance as training progresses. This immediate feedback is invaluable, enabling you to make timely adjustments and troubleshoot issues.
TensorBoard also plays a crucial role in debugging and optimization. The Histograms dashboard visualizes the distribution of tensor values over time, aiding in identifying anomalies, gradient vanishing, or exploding issues. This insight guides optimization efforts and helps ensure the model converges as intended.
Furthermore, TensorBoard fosters collaboration by making it easy to share insights. With TensorBoard, you can visualize your model’s results, training trajectories, and more in an accessible and understandable format. This feature promotes knowledge exchange among team members, regardless of their technical background, facilitating productive discussions and effective decision-making.
For performance optimization, the Profiler tool within TensorBoard is an invaluable asset. It helps identify bottlenecks in your code by profiling time and memory usage across different components of your model. This information empowers you to target optimization efforts where they’re most needed, resulting in faster and more efficient training processes.
In essence, TensorBoard significantly reduces the complexity of working with machine learning models. It enhances transparency, allowing you to gain a deeper understanding of your model’s behavior. With its suite of visualization tools, TensorBoard empowers you to monitor progress, detect issues, optimize performance, and communicate insights seamlessly. Incorporating TensorBoard into your machine learning workflow is not just a convenience; it’s a strategic move that propels your projects forward with improved efficiency and confidence.
What is the Tensorboard Profiler?
Among the array of powerful features TensorBoard offers, the Profiler stands out as a tool that provides essential insights into the performance of your machine learning models. As you delve into the world of optimization and efficiency, the TensorBoard Profiler becomes an invaluable asset in your toolkit.
Understanding Performance Bottlenecks:
The Profiler allows you to identify performance bottlenecks within your model and code. It captures essential information about execution time and memory consumption, highlighting areas where optimizations can make a significant impact. Whether you’re dealing with time-intensive operations or memory-hungry computations, the Profiler’s detailed breakdowns guide you toward the exact parts of your code that demand attention.
Utilizing the Profiling Dashboard:
The Profiler’s user-friendly dashboard provides visualizations that simplify the interpretation of performance data. You can explore the data through different perspectives, such as CPU and memory usage, to gain a comprehensive view of your model’s behavior. Heatmaps and flame graphs offer intuitive representations of time spent in various operations, helping you spot patterns and anomalies with ease.
Spotlight on Optimization:
By pinpointing where your code spends the most time and resources, the Profiler helps you make informed decisions about optimization strategies. Whether it’s optimizing loops, refining memory management, or identifying redundant computations, the insights from the Profiler empower you to fine-tune your model for enhanced efficiency.
Profiling Time and Memory:
The Profiler provides two primary modes of analysis: time and memory. Time profiling focuses on execution time, highlighting the most time-consuming operations and the order in which they occur. Memory profiling, on the other hand, reveals memory allocation patterns and can identify memory leaks or excessive memory usage.
Integration with TensorFlow Operations:
The beauty of the Profiler lies in its seamless integration with TensorFlow operations. You can profile specific TensorFlow functions, operations, or even entire runs, allowing you to zoom in on the details that matter most. This integration means that you don’t have to adapt your workflow significantly; instead, you can enhance it with powerful performance analysis.
Optimizing Across the Workflow:
Whether you’re developing, training, or deploying your model, the Profiler offers insights at every stage of your workflow. It helps you optimize not only the training process but also the inference stage, ensuring that your model performs optimally when deployed in real-world scenarios.
In the ever-evolving landscape of machine learning, optimization is paramount. The TensorBoard Profiler becomes your ally, shedding light on performance bottlenecks and guiding you toward a more efficient model. With its intuitive visualizations and TensorFlow integration, the Profiler empowers you to make data-driven decisions that elevate your machine learning projects to new levels of efficiency and effectiveness.
This is what you should take with you
- TensorBoard is a visualization tool from TensorFlow that helps evaluate machine learning models.
- It can be used to visualize key metrics, the structure of the model, or statistical changes in parameters across epochs.
- Although the tool was developed by TensorFlow, it can now also be used by other machine learning platforms, such as PyTorch.

What is Jenkins?
Mastering Jenkins: Streamline DevOps with Powerful Automation. Learn CI/CD Concepts & Boost Software Delivery.

What are Conditional Statements in Python?
Learn how to use conditional statements in Python. Understand if-else, nested if, and elif statements for efficient programming.

What is XOR?
Explore XOR: The Exclusive OR operator's role in logic, encryption, math, AI, and technology.

How can you do Python Exception Handling?
Unlocking the Art of Python Exception Handling: Best Practices, Tips, and Key Differences Between Python 2 and Python 3.

What are Python Modules?
Explore Python modules: understand their role, enhance functionality, and streamline coding in diverse applications.

What are Python Comparison Operators?
Master Python comparison operators for precise logic and decision-making in programming.
Other Articles on the Topic of TensorBoard
The commands and information from this post are taken from the TensorFlow articles accessible here.

Niklas Lang
I have been working as a machine learning engineer and software developer since 2020 and am passionate about the world of data, algorithms and software development. In addition to my work in the field, I teach at several German universities, including the IU International University of Applied Sciences and the Baden-Württemberg Cooperative State University, in the fields of data science, mathematics and business analytics.
My goal is to present complex topics such as statistics and machine learning in a way that makes them not only understandable, but also exciting and tangible. I combine practical experience from industry with sound theoretical foundations to prepare my students in the best possible way for the challenges of the data world.