In the world of data analysis, univariate analysis is the first step, the foundation, and the art of understanding data, one variable at a time. This essential technique unravels the stories hidden within individual data points before diving into complex multivariate relationships.
In this article, we’ll explore the core concepts of univariate analysis, from data types to visualization techniques and statistical measures. You’ll discover how to transform raw data into meaningful insights, equipping you with valuable skills for various fields, from finance to healthcare and beyond.
Let’s embark on this journey of discovery, where data reveals its tales, and numbers become the brushstrokes on a canvas of understanding. Univariate analysis is your key to unlock the power of data-driven decision-making.
What is the Univariate Analysis?
Univariate analysis is a fundamental technique in data analysis that focuses on examining and summarizing the characteristics of a single variable in isolation. It involves studying a single data attribute or variable at a time, without considering the relationships or correlations with other variables. The primary goal of univariate analysis is to gain insights into the distribution, patterns, and properties of individual variables within a dataset.
Key components of univariate analysis include:
- Data Exploration: This step involves understanding the nature of the variable, its data type (e.g., numerical or categorical), and the range of values it can take. For numerical variables, it explores measures like mean, median, variance, and distribution shape. For categorical variables, it examines the frequency of each category.
- Data Visualization: Visual representations such as histograms, bar charts, box plots, and pie charts are used to illustrate the distribution and characteristics of the variable. These visuals help analysts identify patterns, outliers, and trends within the data.
- Summary Statistics: Univariate analysis calculates summary statistics that provide a concise description of the variable’s central tendency (e.g., mean) and spread (e.g., standard deviation). These statistics offer a snapshot of the variable’s behavior.
- Data Transformation: In some cases, data transformation techniques like scaling, normalization, or log transformation may be applied to make the variable more suitable for analysis or modeling.
- Hypothesis Testing: Univariate analysis can involve hypothesis testing to determine if the variable’s distribution or characteristics differ significantly from a specified expectation or hypothesis.
Univariate analysis serves as a crucial preliminary step before delving into more complex multivariate analyses. It helps analysts identify outliers, understand data quality, and form initial hypotheses about the data. This process is vital in various domains, including finance, healthcare, marketing, and social sciences, where data-driven decision-making relies on a deep understanding of individual variables before exploring their interrelationships.
What are different data types and why are they important for data analysis?
Univariate analysis involves examining individual variables within a dataset to understand their characteristics and distribution. The type of data you’re dealing with plays a crucial role in shaping the methods and techniques used in this analysis. There are two primary data types: numerical (quantitative) and categorical (qualitative), each with its significance in univariate analysis.
1. Numerical Data (Quantitative):
- Continuous Data: Continuous numerical data can take any value within a range. Examples include age, income, temperature, and height. In univariate analysis, understanding the central tendency (mean, median) and spread (variance, standard deviation) of continuous data helps you grasp the data’s variability and distribution.
- Discrete Data: Discrete numerical data consists of distinct, separate values. Examples include the number of children in a family, the count of customer complaints, or the number of products sold. Univariate analysis for discrete data often involves calculating counts, proportions, or percentages of specific values.
- Importance: Numerical data provides essential insights into the magnitude, variation, and patterns within a variable. Univariate analysis helps uncover the data’s statistical properties, identify outliers, and understand its distribution. It lays the foundation for more advanced statistical techniques.
2. Categorical Data (Qualitative):
- Nominal Data: Nominal categorical data represents categories with no inherent order or ranking. Examples include gender, marital status, or types of fruits. Univariate analysis for nominal data focuses on calculating frequencies and proportions for each category.
- Ordinal Data: Ordinal categorical data has categories with a meaningful order or ranking, but the intervals between them are not uniform. Examples include education levels (e.g., high school, bachelor’s, master’s) or customer satisfaction ratings (e.g., low, medium, high). Univariate analysis for ordinal data considers the ranking and may involve calculating medians or mode.
- Importance: Categorical data provides valuable information about groups, classes, or categories. Univariate analysis helps reveal the distribution of these categories and the frequency of each. Understanding the distribution of categorical data is essential for making informed decisions, segmenting data, and identifying patterns.
Why Data Types Matter in Univariate Analysis:
- Appropriate Summarization: The choice of summary statistics, charts, and visualization techniques depends on the data type. For numerical data, you may use histograms or box plots, while bar charts or pie charts are more suitable for categorical data.
- Statistical Tests: Different data types require different statistical tests. For numerical data, you might conduct tests like t-tests or ANOVA, while chi-square tests or contingency tables are used for categorical data.
- Data Transformation: Data type influences whether data transformation techniques like normalization or scaling are necessary. Numerical data may require these transformations for modeling, while categorical data might involve encoding or dummy variable creation.
- Data Understanding: The data type provides insights into the nature of the variable. Is it continuous, indicating a gradual progression, or categorical, representing distinct categories or groups? This understanding is crucial for meaningful interpretation.
In summary, recognizing and distinguishing between numerical and categorical data is fundamental in univariate analysis. Each data type requires tailored approaches to uncover its unique characteristics and distribution, paving the way for deeper insights and informed decision-making.
What is Descriptive Statistics?
Descriptive statistics is a branch of statistics that focuses on summarizing and presenting data in a meaningful and informative way. It provides tools and techniques for analyzing single variables (univariate analysis) and understanding the central tendencies, variations, and distributions of those variables.
The connection between descriptive statistics and univariate analysis is intrinsic, as both are fundamental steps in the exploratory data analysis (EDA) process. Here’s why descriptive statistics are closely linked to univariate analysis:
- Summarizing Data: Descriptive statistics helps you summarize the essential characteristics of a single variable. Univariate analysis, on the other hand, involves exploring and examining one variable at a time, seeking to understand its properties.
- Central Tendency: Descriptive statistics provide measures of central tendency such as the mean, median, and mode. These measures are critical components of univariate analysis, helping you identify the typical or central value within the data.
- Variability: Descriptive statistics offer insights into the variability or spread of data, often through metrics like variance, standard deviation, and range. Univariate analysis involves assessing how data points deviate from the central tendency, giving you a sense of data dispersion.
- Data Distribution: Descriptive statistics also reveal information about the data distribution. Understanding whether data follows a normal distribution or exhibits skewness or kurtosis is vital in univariate analysis to make informed decisions about data modeling and analysis techniques.
- Visualization: Descriptive statistics are complemented by various data visualization techniques, such as histograms, box plots, and density plots, which are integral to univariate analysis. Visualizations help you gain insights into data patterns and distributions.
- Data Cleaning: In both descriptive statistics and univariate analysis, identifying and handling outliers, missing values, or data anomalies is crucial to ensure the accuracy and reliability of results.
- Data Interpretation: Descriptive statistics provide the foundation for interpreting univariate analysis results. For instance, if you calculate the mean and standard deviation of a variable, univariate analysis allows you to examine how individual data points relate to these summary statistics.
- Comparison: Descriptive statistics can be used to compare different univariate datasets. By summarizing each dataset’s characteristics, you can make informed comparisons and draw meaningful conclusions.
In summary, descriptive statistics and univariate analysis go hand in hand in the initial stages of data exploration. Descriptive statistics equips you with the tools to summarize and understand single variables, while univariate analysis allows you to deepen your exploration by examining one variable’s properties, distribution, and relationships to achieve a comprehensive understanding of your data. Together, these techniques lay the groundwork for more advanced statistical analysis and data-driven decision-making.
What are the different Measures of Central Tendency?
Measures of Central Tendency in Univariate Analysis
In univariate analysis, understanding the central tendency of data is fundamental. Measures of central tendency provide insights into where most data points cluster, helping you grasp the typical or central value of a dataset. Here are the key measures:
Mean (Average):
- The mean is the sum of all data points divided by the number of data points.
- It’s sensitive to extreme values (outliers) and is suitable for normally distributed data.
- Calculated as:
\(\) \[ \text{Mean} = \frac{\sum_{i=1}^{n} x_i}{n} \]
Median:
- The median is the middle value in a dataset when arranged in ascending or descending order.
- It’s less affected by outliers, making it suitable for skewed data.
- For datasets with an even number of observations, the median is the average of the two middle values.
Mode:
- The mode is the most frequently occurring value in a dataset.
- It’s ideal for categorical or discrete data but can apply to continuous data as well.
- A dataset can have one mode (unimodal), multiple modes (multimodal), or no mode.
Each of these measures offers unique insights into data central tendencies. When analyzing data, consider using all three to develop a comprehensive understanding of your dataset’s distribution and characteristics.
What are challenges and limitations of Univariate Analysis?
Univariate analysis, the process of studying individual variables in isolation, is a fundamental approach in data exploration and analysis. However, it is essential to recognize its inherent limitations and challenges. Understanding these constraints can help data analysts and researchers make more informed decisions when selecting analytical methods and interpreting results.
One of the primary limitations of univariate analysis is its limited context. This approach focuses exclusively on a single variable at a time, offering insights into that variable’s behavior but often failing to provide a holistic view of complex phenomena. In situations where multiple variables interact and influence each other, relying solely on univariate analysis can result in an incomplete understanding of the underlying relationships.
Another challenge is the potential for oversimplification. Univariate analysis simplifies relationships by not considering interactions between variables. In reality, variables often interact in intricate ways, and their combined effects cannot be adequately captured through univariate examination alone. This can lead to a distorted or overly simplified representation of complex systems.
Moreover, univariate analysis is limited in its ability to establish causation. While it can identify correlations between variables, it cannot determine causation. Correlation does not imply causation, and establishing causal relationships typically requires further experimentation, causal analysis, or controlled studies.
Data quality is a critical factor that affects the effectiveness of univariate analysis. Outliers, anomalies, or missing values in the data can significantly impact the results and interpretations derived from univariate analysis. Therefore, thorough data preprocessing is necessary to ensure the quality and integrity of the data.
Another consideration is the assumption of data distribution. Univariate analysis often assumes that data follows a specific distribution, such as a normal distribution. However, real-world data may deviate significantly from these assumptions, leading to unreliable results when univariate techniques are applied.
Univariate analysis is inherently limited in providing multivariate insights. It focuses solely on individual variables and does not offer insights into how variables relate to each other. For a more comprehensive understanding of complex relationships, multivariate analysis techniques that consider interactions between variables are necessary.
Additionally, univariate analysis may not be suitable for predictive modeling in cases where multiple factors influence outcomes. While it can uncover individual variable behaviors, it often falls short when predicting outcomes influenced by complex interactions between variables.
Sample size is another consideration. The effectiveness of univariate analysis can be influenced by the size of the sample. Small sample sizes may not yield statistically meaningful results, limiting the scope and reliability of the analysis.
Temporal aspects are often overlooked in univariate analysis. It may not adequately capture temporal trends or seasonal patterns in time-series data or data with a temporal component. Understanding temporal dynamics requires specific time series analysis techniques.
Finally, univariate analysis does not address changes or trends over time. Understanding how variables evolve over time necessitates time series analysis or more advanced methods.
In conclusion, while univariate analysis serves as a valuable initial step in data exploration, it is not without its limitations. Recognizing these limitations is essential for informed decision-making about when to employ univariate techniques and when to transition to multivariate methods that consider complex interactions between variables.
How can you use Python for Univariate Analysis?
Python is a versatile and widely-used programming language in the field of data analysis and offers a rich ecosystem of libraries and tools to perform univariate analysis effectively. Here’s a step-by-step guide on how to use Python for univariate analysis:
- Data Collection:
- Start by importing your data into a Python environment. Popular libraries for data handling include Pandas and NumPy. You can read data from various sources, such as CSV files, Excel spreadsheets, or databases.

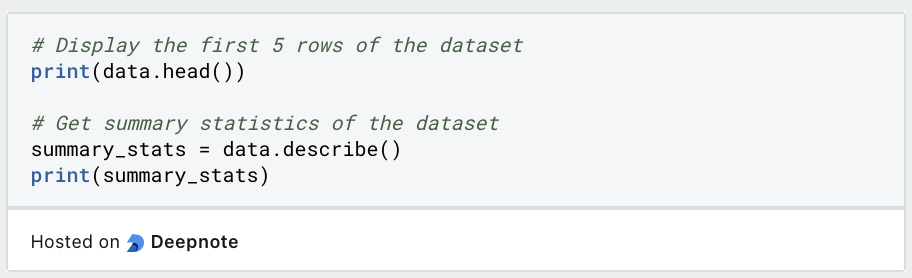
- Data Exploration:
- Begin by exploring your data using Pandas. Use functions like
head(),describe(), andinfo()to get an initial overview of your dataset. These functions provide information about data types, missing values, and basic statistics.
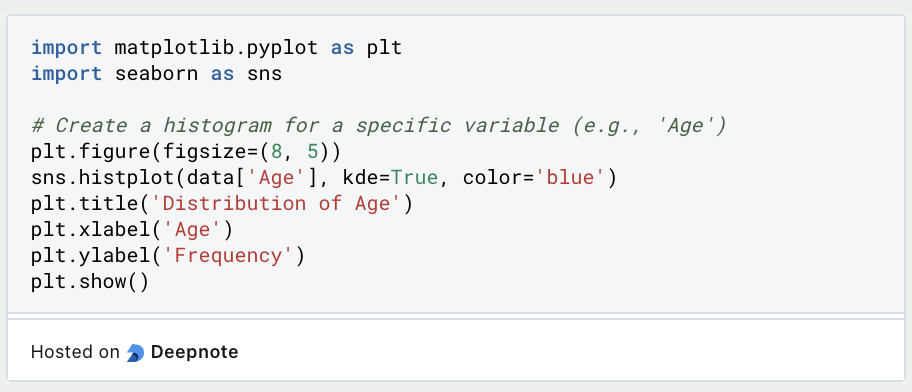
- Data Visualization:
- Visualization is a crucial aspect of univariate analysis. Python offers several libraries for creating informative plots and charts.
- Use Matplotlib for creating static, highly customizable plots. For more interactive and visually appealing visualizations, consider libraries like Seaborn and Plotly.
- Common univariate plots include histograms, box plots, bar charts, and density plots. These help you visualize the distribution and characteristics of individual variables.
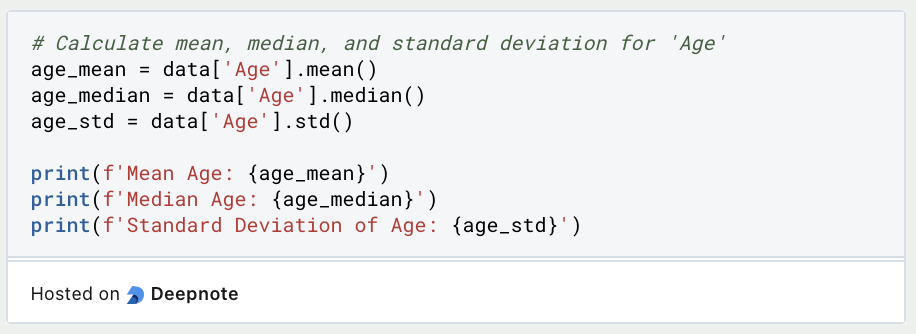
- Descriptive Statistics:
- Python libraries like Pandas offer functions to compute descriptive statistics for your variables. Use
mean(),median(),std(), andvar()to calculate central tendencies and measures of dispersion.
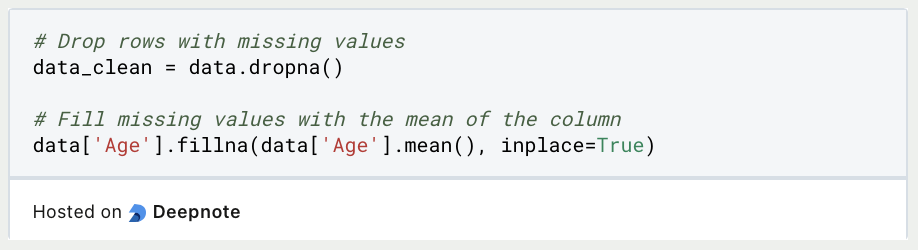
- Handling Missing Values:
- Address missing data by using Pandas functions like
dropna()orfillna(). Consider strategies like mean imputation or interpolation based on the nature of your data.
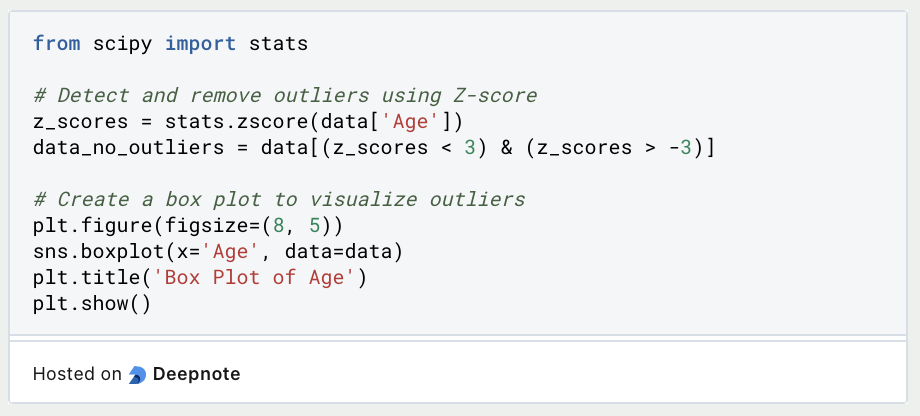
- Outlier Detection:
- Identify and handle outliers using Python libraries like Scipy or specialized libraries like PyOD. Visualizations like box plots and scatter plots can also assist in detecting outliers.
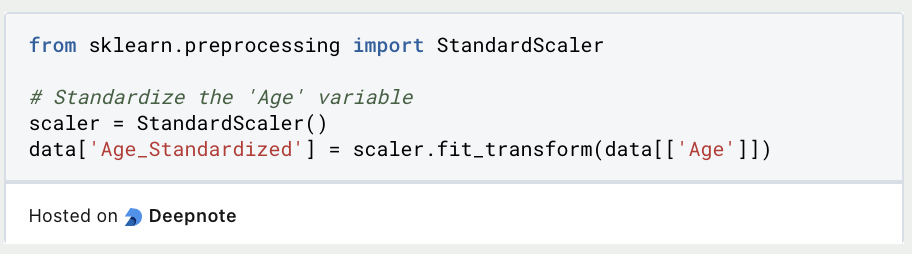
- Data Transformation:
- Depending on your analysis, you may need to transform your data. Common transformations include logarithmic transformations, standardization (scaling), or normalization. Libraries like Scikit-Learn provide preprocessing tools for this purpose.
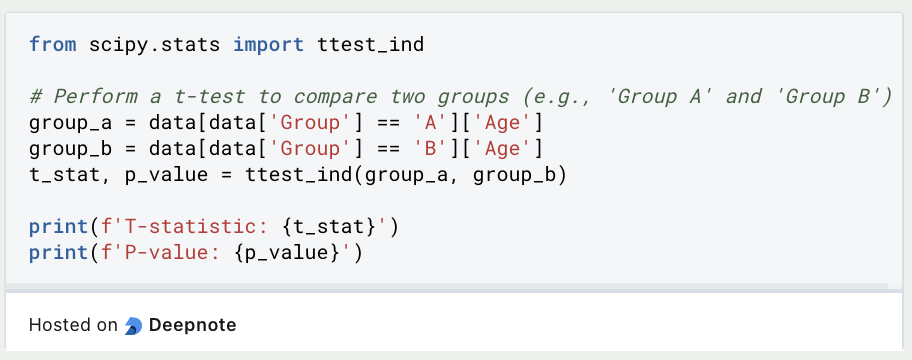
- Statistical Tests:
- Perform statistical tests to assess hypotheses about your data. Python’s Scipy library includes a wide range of statistical tests, including t-tests, ANOVA, chi-square tests, and more. These tests help you make inferences about your data and draw conclusions.
In conclusion, utilizing Python for univariate analysis empowers you to extract meaningful insights from your data efficiently and effectively. This step-by-step guide has shown you how to employ various Python libraries and tools to perform tasks such as data collection, exploration, visualization, descriptive statistics, missing value handling, outlier detection, data transformation, statistical tests, data interpretation, documentation, and advanced analysis.
This is what you should take with you
- Univariate analysis is a fundamental step in data analysis, focusing on understanding individual variables.
- It provides insights into data distribution, central tendencies, variabilities, and basic statistics.
- Different data types (numerical, categorical) require specific techniques for analysis and visualization.
- Descriptive statistics and data visualizations (histograms, box plots, etc.) play a crucial role in univariate analysis.
- Python offers a versatile environment for performing univariate analysis tasks efficiently.
- Libraries like Pandas, Matplotlib, Seaborn, and Scipy are valuable tools in Python for univariate analysis.
- Handling missing data, detecting outliers, and transforming data are essential data preprocessing steps.
- Univariate analysis equips data analysts with the foundational skills needed to uncover insights, detect anomalies, and prepare data for more advanced analyses. It’s a crucial step in the data analysis process, allowing you to understand individual variables before delving into multivariate relationships.

What is OpenAPI?
Explore OpenAPI: A Comprehensive Guide to Building and Consuming RESTful APIs. Learn How to Design, Document, and Test APIs.

What is Data Governance?
Ensure the quality, availability, and integrity of your organization's data through effective data governance. Learn more here.

What is Data Quality?
Ensuring Data Quality: Importance, Challenges, and Best Practices. Learn how to maintain high-quality data to drive better business decisions.

What is Data Imputation?
Impute missing values with data imputation techniques. Optimize data quality and learn more about the techniques and importance.
What is Outlier Detection?
Discover hidden anomalies in your data with advanced outlier detection techniques. Improve decision-making and uncover valuable insights.

What is the Bivariate Analysis?
Unlock insights with bivariate analysis. Explore types, scatterplots, correlation, and regression. Enhance your data analysis skills.
Other Articles on the Topic of Univariate Analysis
IBM has an interesting article on the topic of General Linear Model Univariate Analysis that you can find here.

Niklas Lang
I have been working as a machine learning engineer and software developer since 2020 and am passionate about the world of data, algorithms and software development. In addition to my work in the field, I teach at several German universities, including the IU International University of Applied Sciences and the Baden-Württemberg Cooperative State University, in the fields of data science, mathematics and business analytics.
My goal is to present complex topics such as statistics and machine learning in a way that makes them not only understandable, but also exciting and tangible. I combine practical experience from industry with sound theoretical foundations to prepare my students in the best possible way for the challenges of the data world.