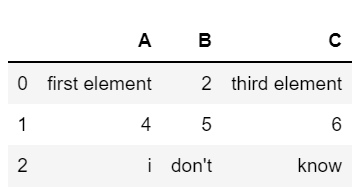
The DataFrame (short: DF) in the Python library Pandas can most easily be thought of as a table-like object consisting of data stored in rows and columns. Pandas offers, simply speaking, the same possibilities as structured arrays in NumPy with the difference that the rows and columns can be addressed by name instead of having to call them by number index. This makes working with large data sets and many columns easier and the code more understandable.
What is Pandas?
Pandas is a powerful open-source data manipulation library for Python. It provides a powerful, easy-to-use data structure called DataFrame that is particularly useful for data analysis tasks. The easiest way to think of Pandas is as the “Excel of Python,” because many functionalities from Microsoft Excel can also be performed with Pandas. In addition, however, Pandas has many more functionalities and is also significantly more performant.
What is a Pandas DataFrame?
A Pandas DataFrame is a two-dimensional, labeled data structure that resembles a spreadsheet or SQL table. It consists of rows and columns, where each column can have a different data type. The rows and columns are assigned a unique index or column name, which makes it easy to select, filter, and manipulate data.
How can DataFrames be understood?
Before we can start creating DFs, we need to understand what objects they can be composed of. This knowledge is necessary because there are different ways to create DFs and they depend on which data object you use as a base. This is the only way to understand the possibilities of DFs and how they differ from pure tables, with which they are often compared.
To understand the following sections, a basic knowledge of data structures in Python and Pandas is a prerequisite. If you don’t have this or want to refresh your knowledge, feel free to use our articles on Pandas Series and Python Dictionary.
DataFrame as a collection of Series objects
The Series object in Pandas is a one-dimensional array with a mutable index for calling individual entries. In Python you can create such an object with the following command:
import pandas as pd

area_dict = {‘California’: 423967, ‘Texas’: 695662, ‘New York’: 141297, ‘Florida’: 170312, ‘Illinois’: 149995}
area = pd.Series(area_dict)
The Series has as index different American states and the corresponding area of the state in km². A second series with the same index, i.e. the same five American states, contains the number of inhabitants per state.
population_dict = {‘California’: 38332521, ‘Texas’: 26448193, ‘New York’: 19651127, ‘Florida’: 19552860, ‘Illinois’: 12882135}
population = pd.Series(population_dict)
Since both Series objects have the same index, we can combine them into one DataFrame object, with the index values (the five states) as rows and the categories (area and population) as columns:
states_df = pd.DataFrame({‘population’: population, ‘area’: area})Just like the Series objects before it, the DF still has an index that can be used to target the rows:
states.indexIn addition, the columns of the table-like DataFrame can also be accessed by their names:
states.columnsDataFrame as a specialized dictionary
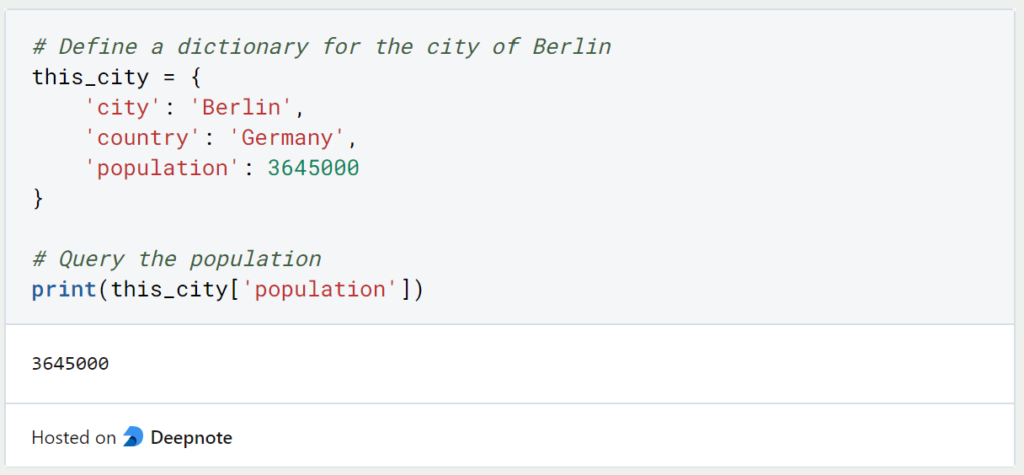
Another approach to interpreting DF objects is to think of it as a specialized dictionary, where the DF maps a column to a Series object within the column, just as a dictionary maps a key to a value. We can also query it in the same way as a dictionary, but get the whole column rather than just a specific value:
states[‘area’]How to create a Pandas DataFrame?
In general, there are four different ways to create a DF, all of which can be useful depending on the use case:
- From a single Series object. The DF is a collection of multiple Series objects. However, it can also be created from a single Series and then have only one column:
pd.DataFrame(population, columns=[‘Population’]2. From a list of dictionaries. Even if not all dictionaries have the same keys, the missing values are filled with NaN (‘not a number’). The number of columns is therefore the number of unique keys and the number of rows is the number of dictionaries:
pd.DataFrame([{'a': 1, 'b': 2}, {'b': 3, 'c': 4}])3. From a dictionary of Series objects. This way has already been described in detail in the previous sections:
pd.DataFrame({‘population’: population, ‘area’: area})4. From a two-dimensional Numpy array. Multiple two-dimensional Numpy arrays can be combined into one DF. If no labels are maintained as column names, numbers are used as column index:
pd.DataFrame(np.array([[1, 2], [3, 4]]), columns=[col1, col2'], index=['row1', row2’])How can an Excel or CSV file be read in?
If you don’t want to create a new object and instead want to use an already existing file, this can also be implemented with Pandas. Using the functions “read_csv()” or “read_excel()” the corresponding files can be read and are directly converted into a DataFrame.
import pandas as pd

df = pd.read_csv("name_of_csv.csv")
df2 = pd.read_excel("name_of_excel.xlsx")
It is important to note the correct extension of the file in the name. Otherwise, errors may occur.
Can you create a DataFrame in a for loop?
In other programming languages, such as R, it is normal to create an empty object and then fill it step by step with a loop, as you can do with lists in Python, for example. This approach is possible with Panda’s DataFrames, but should not be used if possible. Data should be stored in lists or dictionaries first, and then summarized as a DF in one step. This approach saves a lot of time and storage capacity (see also Stack Overflow).
What are the best practices when working with a Pandas DataFrame?
The Pandas DataFrame is a versatile and powerful data structure that can be used in many applications. To get the most out of these all-rounders, a few best practices should be followed to ensure that DataFrames are used well and errors are avoided as far as possible.
1. Import Pandas Correctly
When importing the module into a Python script or a Jupyter notebook, Pandas should usually be imported in its entirety. In addition, the general abbreviation “pd” should be used, as it is easy to understand and shortens the following code.
import pandas as pd
2. Use read_csv and read_excel for Data Input
When working with Excel and CSV files, you should use the functions provided by Pandas for this purpose, i.e. pd.read_csv() and pd.read_excel(). This ensures that the files are read efficiently and data types are recognized automatically.
df = pd.read_csv('data.csv')3. Set the Index Wisely
The index of a DataFrame is a powerful tool that distinguishes it from other data structures, such as the NumPy array. Use a suitable column to set the index, making data retrieval and manipulation much easier.
df.set_index('date', inplace=True)4. Avoid Iterating Over Rows
Although Pandas offers a powerful part for iterating over rows, this step should be avoided if possible. Instead, work with functions that can perform operations on complete columns or convert the columns to a different data structure beforehand to achieve optimal performance.
# Bad practice (slow):
for index, row in df.iterrows():
    df.at[index, 'new_column'] = row['old_column'] * 2

# Better practice (faster):
df['new_column'] = df['old_column'] * 2
5. Use .loc and .iloc for Selection
These functions can be used to simply select or query individual lines. .loc is used for index-based queries and .iloc allows the lines to be queried by specifying the integer. These options are much more efficient than using parentheses.
# Label-based indexing
df.loc[df['column'] > 5]

# Integer-based indexing
df.iloc[2:5, 1:3]
6. Avoid Chained Indexing
The use of nested indexing, such as that known from nested lists, should be avoided as far as possible in order to avoid errors and unpredictable behavior. Instead, the indexing functions can be used for such a query.
# Bad practice (chained indexing)
df['column']['row']

# Better practice (explicit indexing)
df.loc['row', 'column']
7. Handle Missing Data Appropriately
Pandas is an incredibly powerful tool for data manipulation. It offers various options for dealing with empty fields. These can either be filled with a new value or the entire row or column can be deleted.
# Replace missing values with the mean
df['column'].fillna(df['column'].mean(), inplace=True)
8. Avoid In-Place Modifications
If changes are made to a DataFrame, such as removing columns or changing values, it is best to avoid changing the original object in case of unforeseen problems. Instead, a new data object should be used.
# In-place modification (use with caution)
df.drop('column', axis=1, inplace=True)

# Safer approach (creates a new DataFrame)
new_df = df.drop('column', axis=1)
9. Optimize Memory Usage
With large data sets, DataFrames can block a lot of memory space in the working memory. To prevent this, optimized data types should be used where possible. For example, numerical values can be saved with different accuracies. By default, Pandas usually uses the data type with the highest precision, but also the highest memory requirement.
df['category_column'] = df['category_column'].astype('category')These methods and best practices ensure that efficient and simple work with DataFrame objects is possible and that the code remains maintainable and error-free. However, there are many more functions and options for working with these tabular data structures. You can find these either on our website or in the official documentation.
This is what you should take with you
- The Pandas DataFrame is a very important element in data preparation for artificial intelligence.
- It can be understood as a SQL table with rows and columns, but it offers even more functionalities.
- The DataFrame can be understood as a collection of Series objects or as a specialized dictionary.
- It can be created either from a single Series object, from a list of dictionaries, from a two-dimensional NumPy array or from a dictionary of Series objects.
- In addition, it is possible to read the DataFrame directly from a file, such as a CSV or Excel file.

Python Programming Basics: Learn it from scratch!
Master Python Programming Basics with our guide. Learn more about syntax, data types, control structures, and more. Start coding today!

What are Python Variables?
Dive into Python Variables: Explore data storage, dynamic typing, scoping, and best practices for efficient and readable code.

What is Jenkins?
Mastering Jenkins: Streamline DevOps with Powerful Automation. Learn CI/CD Concepts & Boost Software Delivery.

What are Conditional Statements in Python?
Learn how to use conditional statements in Python. Understand if-else, nested if, and elif statements for efficient programming.

What is XOR?
Explore XOR: The Exclusive OR operator's role in logic, encryption, math, AI, and technology.

How can you do Python Exception Handling?
Unlocking the Art of Python Exception Handling: Best Practices, Tips, and Key Differences Between Python 2 and Python 3.
Other Articles on the Topic of Pandas DataFrame
- You can find the official documentation of Pandas here.

Niklas Lang
I have been working as a machine learning engineer and software developer since 2020 and am passionate about the world of data, algorithms and software development. In addition to my work in the field, I teach at several German universities, including the IU International University of Applied Sciences and the Baden-Württemberg Cooperative State University, in the fields of data science, mathematics and business analytics.
My goal is to present complex topics such as statistics and machine learning in a way that makes them not only understandable, but also exciting and tangible. I combine practical experience from industry with sound theoretical foundations to prepare my students in the best possible way for the challenges of the data world.