A histogram is a visualization form from the field of statistics, which is used to clarify frequency distributions. It involves counting the data points that belong to a defined group and then displaying their values in individual bars.
What is a histogram?
In statistics, it is often of interest how some variables are distributed. Such frequency distributions can be displayed with so-called histograms. This is a simple way of expressing the distribution of a data set for a variable. Our example shows how our study unit’s age distribution is represented.
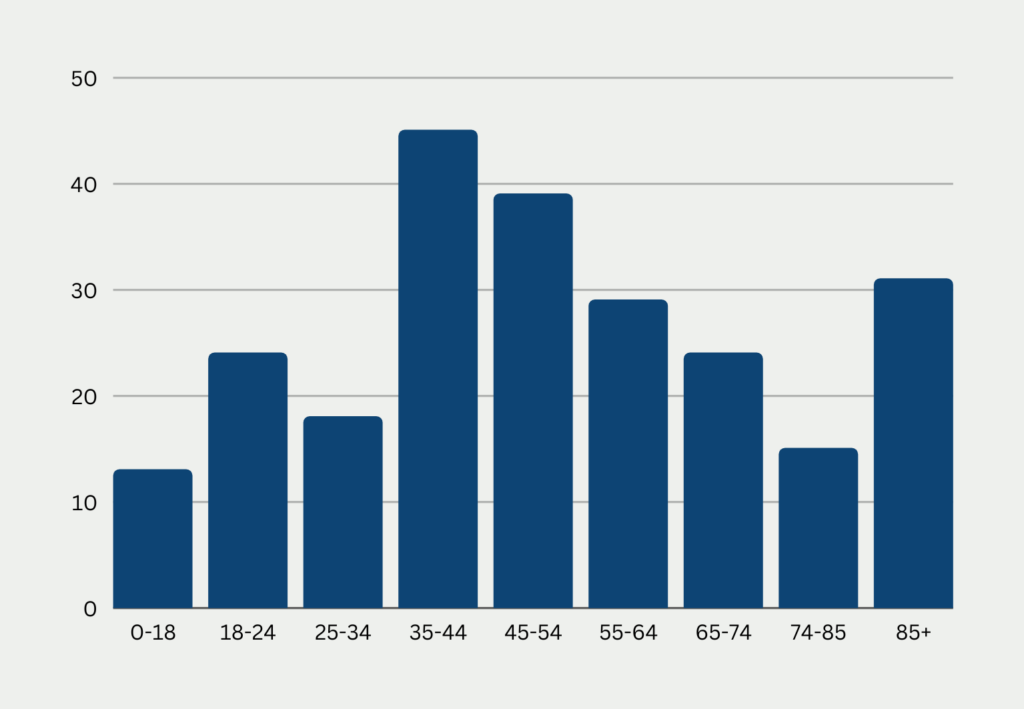
The same diagram could of course also be displayed with other variables, such as salary, height, or weight. It is characterized by the fact that the so-called class width can be freely selected. For example, we have decided to always group all persons in steps of nine years. In the same way, however, we could also create a new histogram, this time always grouping all age groups in an interval of 20 years.
In this respect, the histogram also differs from a regular bar chart, which, on the other hand, is used when the classification into classes, for example, according to gender, is already clear from the outset and cannot be chosen arbitrarily.
At the same time, there is also the distinction of counting the occurrence of the characteristic either absolutely, as we did, or relatively. In this case, the number of data points with the characteristic is divided by the number of all data points and thus the relative frequency of the characteristic is represented.
When is it useful to use a histogram and when is it not?
Histograms are particularly suitable when the following characteristics are fulfilled:
- Only the distribution according to one variable is to be displayed. On the other hand, representation is not defined in several dimensions.
- The distribution of this variable should be continuous, meaning there are no or only a few gaps. Thus, if in our dataset the age group between 40 and 60 is almost not represented at all, perhaps another form of representation should be chosen.
- Histograms provide a very good way to assess the significance of different data sets. For example, it may be that one data set detects a significant correlation between online marketing spend and increased company sales, while the other data collection does not. By comparing the histograms of both survey units with regard to age, one may quickly discover that the two surveys have surveyed very different age groups. Thus the findings are only valid for the age strata studied.
- With the help of histograms, it is additionally very easy to identify outliers, since these are recognizable as individual bars that are very skewed. Outliers can, for example, be caused by erroneous data entries or can actually be part of the data set and data distribution. Many machine learning models react to the presence of outliers with poorer results, which is why the data set must be searched in advance. Histograms are useful for quickly detecting these and identifying appropriate methods for filtering.
However, as mentioned earlier, a histogram should not be confused with the traditional bar chart, which should be used primarily when the variables are categorical rather than numerical. That is, the class is inherently predetermined, such as gender, and cannot be freely chosen, such as the age range in our example.
The histogram is a way of representing a frequency distribution. Of course, such a distribution is only really recognizable from a certain amount of data, which is why this form of representation should only be used from a certain data set size. Otherwise, one quickly draws a false conclusion about the underlying distribution of the data set. In addition, the histogram is not really suitable if the data set does not contain information for all groups and therefore certain areas of the diagram cannot be filled.
What should be considered when using histograms?
In order to use and interpret histograms correctly, one should follow some rules that have proven to be best practices. First, it makes sense to always use zero as the base value to ensure better comparability. Otherwise, if the y-axis does not start at zero, there can often be confusion in the interpretation.
The number of classes is an important factor that significantly influences the quality of the analysis. If too many classes, i.e. bars, are displayed, significant characteristics may no longer be displayed correctly and the diagram may also become rather confusing, since the individual bars are comparatively thin. If there are too few classes, on the other hand, the significance of the diagram suffers because not enough details are shown.
Finally, the classes should be of equal size so that the user can quickly understand the statement. The occurrence of a feature in a class is represented by the area of the bar. If the individual classes are of different sizes, the width of the bars changes. However, it is much easier to just look at the height of the bars during the interpretation instead of having to compare the area, i.e. the height and width of the bars.
What applications use this type of diagram?
This type of visualization is used in various fields:
- In statistics, the histogram can be used to visualize and examine the probability distribution of a data set.
- In photography, on the other hand, this form of representation is also called the tone value diagram and shows how often a color occurs in an image. For each color, the number of pixels that have the specified color in the image is counted. With the help of this diagram, a photographer can see whether the exposure and contrast have been chosen correctly and make changes accordingly.
How to create histograms with Matplotlib?
With the help of Matplotlib, various diagrams can be displayed as easily as possible in Python. For most diagram types, there are already preconfigured modules that can be used relatively easily for your own example.
Accordingly, you can also define a simple command to create a simple diagram. The example was taken from the Matplotlib website:

After importing the modules, we can define a normal distribution using Numpy, which we then want to display in the chart. For this, we define the mean of 170 with a standard deviation of 10 and a data set the size of 250.
This Numpy array can be easily transformed into a chart using the “hist” function. The command “plt.show()” is then used in Matplotlib to display the created chart.
What types of diagrams are used in Business Intelligence applications?
There are several types of charts used in Business Intelligence (BI) to represent data and help users visualize and analyze information. Here are some of the most common chart types:
- Bar charts: Bar charts are used to compare data across categories or groups and are one of the most common chart types in BI. While they are very similar to histograms, they should not be confused.
- Histograms: A histogram is a visualization form from the field of statistics that is used to illustrate frequency distributions. It involves counting the data points that fall into a defined group and then displaying their values in individual bars.
- Line charts: Line charts are used to show trends over time and are useful for visualizing changes in data over a period of time.
- Scatter plots: Scatter plots are used to show the relationship between two variables and are commonly used in BI to identify patterns and correlations.
- Heat maps: heat maps are used to represent data in color and are useful for highlighting patterns and trends in large data sets.
- Tree charts: used to represent hierarchical data, tree charts are used in BI to show the size and composition of different categories of data.
- Pie charts: Pie charts are used to show the composition of data and are suitable for showing proportions and percentages.
- Sankey charts: Sankey diagrams are used to visualize the flow of data or processes and are useful for understanding complex systems and processes.
- Bubble charts: Used to show the relationship between three variables, bubble charts are often used in BI to identify patterns and correlations.
These are just a few examples of the many types of charts used in business intelligence. The choice of chart type depends on the data to be analyzed, the goals of the analysis, and the user’s preferences.
This is what you should take with you
- The histogram is a visualization form from the field of statistics, which is used to clarify frequency distributions.
- It is used to represent continuous, numerical variables and their distributions. In practice, these are, for example, characteristics such as age, height or income.
- In photography, the histogram is used to show the colors used in an image. Photographers use this information to correctly adjust exposure and other characteristics.

What is Gibbs Sampling?
Explore Gibbs sampling: Learn its applications, implementation, and how it's used in real-world data analysis.
What is a Bias?
Unveiling Bias: Exploring its Impact and Mitigating Measures. Understand, recognize, and address bias in this insightful guide.

What is the Variance?
Explore variance's role in statistics and data analysis. Understand how it measures data dispersion.
What is the Kullback-Leibler Divergence?
Explore Kullback-Leibler Divergence, a vital metric in information theory and machine learning, and its applications.
What is the Maximum Likelihood Estimation?
Unlocking insights: Understand Maximum Likelihood Estimation (MLE), a potent statistical tool for parameter estimation and data modeling.

What is the Variance Inflation Factor (VIF)?
Learn how Variance Inflation Factor (VIF) detects multicollinearity in regression models for better data analysis.
Other Articles on the Topic of Histograms
You can find Matplotlib’s documentation on histograms here.

Niklas Lang
I have been working as a machine learning engineer and software developer since 2020 and am passionate about the world of data, algorithms and software development. In addition to my work in the field, I teach at several German universities, including the IU International University of Applied Sciences and the Baden-Württemberg Cooperative State University, in the fields of data science, mathematics and business analytics.
My goal is to present complex topics such as statistics and machine learning in a way that makes them not only understandable, but also exciting and tangible. I combine practical experience from industry with sound theoretical foundations to prepare my students in the best possible way for the challenges of the data world.