The term Business Intelligence (BI) covers all processes, technologies, or activities that are used to make data-driven decisions within a company. This includes, for example, the statistical analysis of data or the visualization of information in diagrams. The goal of Business Intelligence is to generate knowledge from information and thus be able to make better decisions.
What is Business Intelligence?
Business Intelligence includes various aspects that are required for the collection of internal and external data, its preparation, and its illustration. In addition to concrete BI tools, this also includes work processes, data understanding, and much more.
The aim is to present the collected data in a qualitatively and quantitatively correct manner and to make it available to decision-makers. The insights that can be drawn from the diagrams are then to be used for data-driven decisions and thus improve their quality. Evaluations are available for this purpose, such as aggregations (totals, average values, etc.) or statistical analyses (historical distributions).
Since the data originates primarily from the past or, in the case of real-time analyses, from the present, the horizon of Business Intelligence is primarily predictive, i.e. past-oriented. It attempts to draw conclusions from past data and use them for current decisions.
What is the difference between Business Intelligence and Business Analytics?
Business Analytics includes solutions and approaches for calculating forecasts and trends. This involves using past data to calculate the most likely continuation of trends. In contrast to Business Intelligence, the focus is therefore on the future. Business Analytics is therefore primarily used for longer-term business decisions that require the ability to estimate future scenarios.
In public perception, however, the two terms are often confused and used as synonyms. This can lead to confusion in many articles or descriptions. In the literature, however, the two terms are distinguished, as already described, on the basis of the decision horizon between the present and the future.
Which components are needed for Business Intelligence?
In order to be able to operate good BI analyses within a company, sufficient infrastructure is required from the collection of data to the final creation of diagrams and calculations. The following components should be present in a good BI architecture:
- Data Warehouse: This central data store ensures that there is a so-called single point of truth within the company. This means that BI analyses are based on a common database and data quality is ensured. Furthermore, the access structure can be established centrally by defining who is allowed to access which data.
- ETL: The Extract-Transform-Load (ETL) process enables the integration of multiple data sources into a central data warehouse. To do this, data is extracted from its original source, then transformed into the target format, and finally stored in a data warehouse or another database. This allows heterogeneous structures between different data sources to be unified.
- OLAP: Online Analytical Processing enables business analysts to view data from multiple dimensions and thus perform new analyses. For example, a company’s sales can be viewed from the dimensions of time, products, or customer country. This results in new perspectives and insights from the data.
What are the benefits of using BI?
The use of Business Intelligence is especially helpful in improving the decision-making process in companies and making them more informed. By basing decision-making on data, the decision is more comprehensible and no longer relies so heavily on the opinion or view of the individual.
Furthermore, BI analyses make it possible to access huge amounts of data in a data warehouse or data lake quickly and easily. In addition, it is also available to a larger amount of employees within the company, as the tools are mostly easy to learn and do not require SQL or other specialized knowledge in the basic function.
The insights that BI reports create improve key business functions and thus lead to higher customer satisfaction. For example, Business Intelligence can be used in sales to find out how the production process can be further accelerated and improved. Customers then benefit not only from shorter delivery times but also from better product quality.
In addition, with good data architecture, current or even real-time data can also be processed so that the company can be monitored continuously and changes can be seen more quickly.
What is Business Intelligence used for?
Business Intelligence can be used in a wide variety of areas. The most common use cases include:
- Sales: BI analyses in sales can be used to quickly record customer activity and react to possible changes in purchasing behavior. For example, it is possible to recognize at an early stage when a customer is dissatisfied and it is becoming apparent that he will buy the competitor’s product instead.
- Purchasing: Sufficient supply of raw materials and intermediate products has become an important building block in almost all industries. With the help of Business Intelligence, supply chains can be controlled and the path of goods can be tracked in detail. In addition, for example, purchase prices can be visualized over a period of time to keep an eye on price developments.
- Production: A good understanding of the production process leads to the ability to improve and accelerate processes and ultimately save money or increase quality. To identify bottlenecks, process analyses can be used that use real-time data to show which production steps take how much time.
- Marketing: Nowadays, marketing has a variety of channels to promote a product and establish direct or indirect contact with the customer. In order to be able to centrally track and compare the various campaigns in the e-mail area or on social media, BI analyses are a good way to avoid having to jump between different systems.
What features should a BI tool have?
In addition to the key features that a BI tool should bring, such as the ability to create visual charts and reports, there are other important factors that are key when selecting a system.
The interface and operation of the tool should be user-friendly and easy to learn. This will enable many employees to use the system without having to organize expensive and time-consuming training sessions. Furthermore, it should already have a broad user base so that your employees can access forum posts or YouTube videos, for example, and not have to ask expensive consultants for help.
The application should also support different output formats, allowing analyses to be viewed either on the desktop, tablet, or even smartphone. This offers the possibility to access the latest evaluations always and everywhere and to speed up the decision-making process even more.
In addition, it should be possible to send specific notifications in order to be able to warn employees early and reliably when a limit value is exceeded or not reached. This makes it possible, for example, to react quickly to costs that are rising too sharply or to shut down the production process if defective parts are being produced.
What are the most widely used BI tools?
When selecting a suitable BI tool for your company, several factors play an important role in the decision-making process. These can be quite individual, which is why it is difficult to make a general recommendation. The following tools are widely used in various industries and therefore represent a good starting point when searching for a suitable tool:
Microsoft Power BI
Microsoft Power BI is a good option for getting started in Business Intelligence. It can be used for free to a certain extent and is easy to learn for many users, as it stays very close to the interface and functionalities of Microsoft Office, which many users are already familiar with.
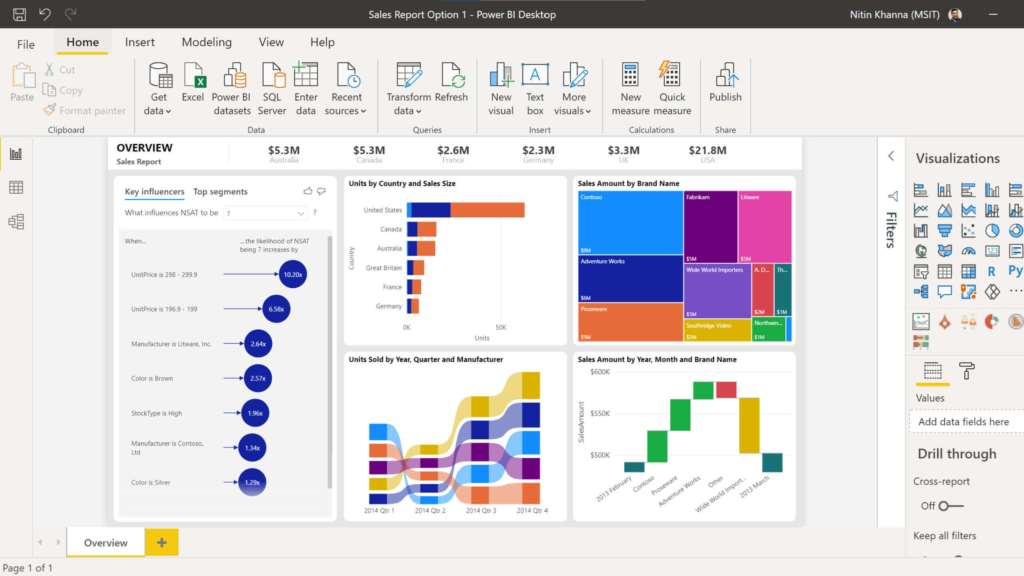
In addition, Power BI already has many connectors to various data sources that can be directly connected and used without any problems. The easiest way to start in Power BI is by using an Excel or CSV file with data.
Tableau
Tableau is very similar to Power BI in most respects. It also offers the possibility to test certain functionalities and applications for free. In addition, there are comparable connectors for data sources, such as Google Analytics or Microsoft SQL.
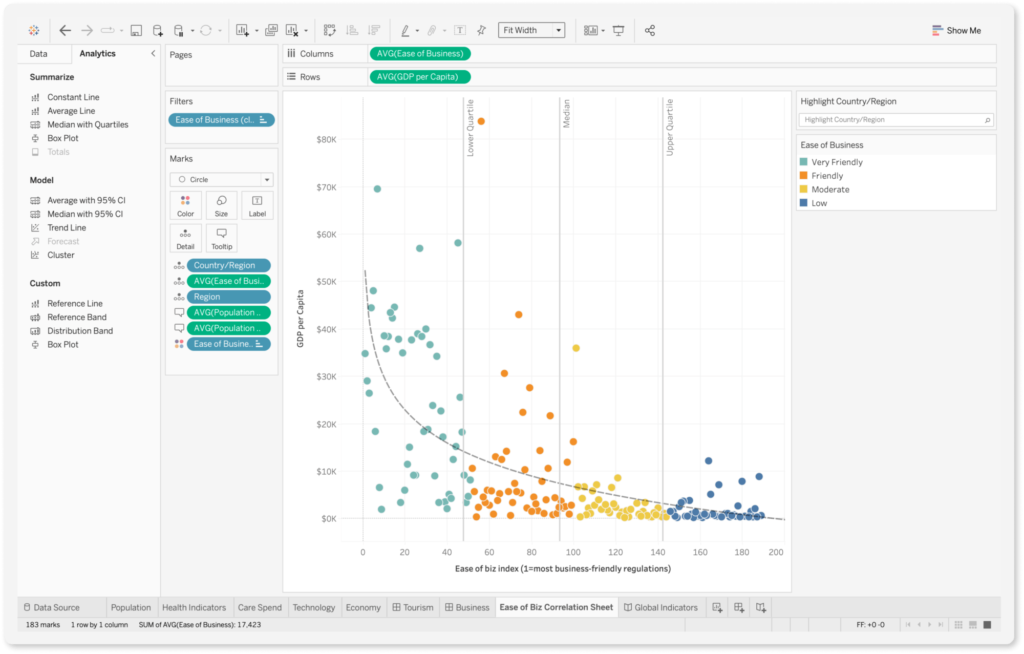
In the application, some users complain that learning and getting to know Tableau takes some time and is not necessarily intuitive. However, extensive functionalities and possibilities are available as soon as one gets used to using Tableau.
Oracle BI
Oracle BI is not yet as well-known and widespread as Power BI and Tableau. However, it offers a solid alternative that makes the integration of Oracle data sources, particularly easy.
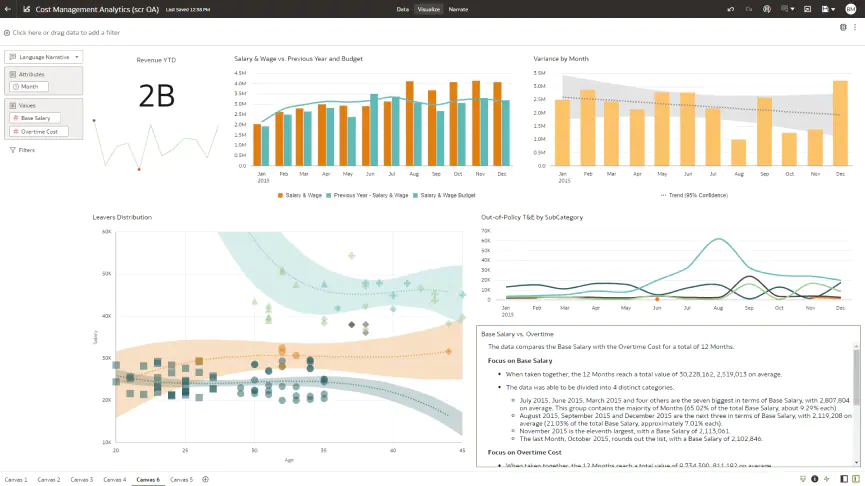
Among the main advantages of Oracle BI, besides ease of use, are the many different options when creating notifications.
This is what you should take with you
- Business Intelligence encompasses all processes, technologies, or activities used to make data-driven decisions within an organization.
- Unlike Business Analytics, Business Intelligence deals with past-based data and attempts to support current decisions. Business Analytics, on the other hand, attempts to create predictive models to show future trends.
- Business Intelligence can be used in areas such as sales, purchasing, marketing, or production.

What is Data Privacy?
Explore the essence of data privacy in our world. Uncover regulations, best practices, and the evolving landscape of personal information.

How can you create a website without hiring a developer?
In the past, building a new website usually required hiring an external service provider. Web developers still exist today, but they can be expensive. That’s why it’s great that there are also free options available. Here you can find out what they are and how you can benefit from them. What is a web developer?… Read More »How can you create a website without hiring a developer?

What is Knowledge Representation?
Explore Knowledge Representation in AI: Learn how machines store and process knowledge, powering the future of artificial intelligence.

What is Collaborative Filtering?
Unlock personalized recommendations with collaborative filtering. Discover how this powerful technique enhances user experiences. Learn more!

What is Quantum Computing?
Dive into the quantum revolution with our article of quantum computing. Uncover the future of computation and its transformative potential.

What is Anomaly Detection?
Discover effective anomaly detection techniques in data analysis. Detect outliers and unusual patterns for improved insights. Learn more now!
Other Articles on the Topic of Business Intelligence
The pages of the BI tools are linked here again clearly:

Niklas Lang
I have been working as a machine learning engineer and software developer since 2020 and am passionate about the world of data, algorithms and software development. In addition to my work in the field, I teach at several German universities, including the IU International University of Applied Sciences and the Baden-Württemberg Cooperative State University, in the fields of data science, mathematics and business analytics.
My goal is to present complex topics such as statistics and machine learning in a way that makes them not only understandable, but also exciting and tangible. I combine practical experience from industry with sound theoretical foundations to prepare my students in the best possible way for the challenges of the data world.