The Z-score, also known as the standard value, is a statistical concept used for data analysis and hypothesis testing. It measures how many standard deviations an individual observation or data point is away from the mean of the distribution. The Z-score can be used to identify outliers and understand the variability of the data. This metric is used in a wide variety of applications, such as finance, engineering, and medicine.
This article deals with the basic concept of the Z-score, the mathematical calculation, and the advantages and disadvantages of its use.
What is the Z-score?
The Z-score is a statistical measure, also known as the standard value, which indicates the number of standard deviations of a data point from the mean value of the data set. Simply put, this metric measures how far a data point is from the mean. This key figure is used to standardize data and make data sets comparable with each other. The data point itself is often not meaningful enough for this.
This becomes particularly clear in the following example from school. Two students from different classes at the same level have received their exam grades in mathematics. Student A has written a B+, while student B has received the exam back with a grade of C. Student A now claims to be better at math, as a B+ is a better grade than a C. Student B, on the other hand, replies that her exam was particularly difficult and that she is, therefore, the better math student.

To support this claim, she argues that the exam in her class had an average grade of D, while the average grade in student A’s class was B. This means that she performed significantly better than the average compared to pupil A. Although student B is generally correct with her statement, for a neutral comparison not only the average of the class but also the standard deviation must be taken into account. She can use the Z-score for this. How this is calculated is explained in more detail in the next chapter.
How to calculate the Z-score?
The formula for calculating the Z-score is relatively straightforward. First, the deviation of the data point from the mean value of the data set is calculated. To standardize this difference and thus make it comparable, it is then divided by the standard deviation. This results in the formula:
\(\) \[z = \frac{(x – \mu)}{\sigma}\]
Where:
- \(z\) is the Z-score
- \(x\) is the data point or value
- \(\mu\) is the mean value of the data set
- \(\sigma\) is the standard deviation of the data set
To calculate the Z-score in practice, the following steps must be carried out:
- Calculate the mean value (\(\mu\)) of the data set: The arithmetic mean is used for this. This means that all data points are added together and then divided by the total number of data points.
- Calculate the standard deviation (\(\sigma\)) of the data set: The standard deviation measures the average deviation of a data point from the mean value. To do this, the difference in the mean value is calculated for each data point and then squared. These squared differences are then added together and divided by the total number of data points. Finally, the square root of this result must be formed so that the value is again in the same unit as the data set.
- Select a specific data point: The Z-score is always calculated for a specific data point and not for the entire data set. A specific point must therefore be selected for a calculation.
- Calculate the difference between the mean value and the data point.
- Divide the result by the standard deviation (\(\sigma\)).
A positive Z-score means that the selected data point is above the mean and a negative value means that it is below the mean. The higher the absolute value, the more the data point deviates from the mean value. This value can be used to determine the relative position of the data point in the distribution and the data point values can be determined.
How is it involved in the standardization of data?
The Z-score is a statistical measure that measures the deviation of a data point from the mean as a function of the standard deviation. It can be used to standardize data by abstracting the complete data set from the underlying scale and measuring each data point only by the associated Z-score. Otherwise, different variables may show distortions as they have scale differences, i.e. are measured in different values. A data set of household incomes in a country, for example, has a higher deviation from the mean value, as this is measured in thousand euro increments, than a data set on bread prices in different cities.
Standardization using the Z-score makes it easier to compare and contrast data sets and also makes it easier to identify patterns and relationships in the data. In addition, Z-scores are useful for detecting outliers or other unusual observations that are very far from the mean.
What are the applications of the score in hypothesis testing and statistical inference?
The Z-score plays an important role in various statistical tests. It is mainly used in the following areas:
- Hypothesis testing: A hypothesis test aims to investigate whether a hypothesis deviates significantly from a normal distribution or not. The Z-score can be used to calculate how far the sample mean deviates from the population mean, i.e. the normal distribution. This value can then be compared with a critical value of the normal distribution to determine whether the sample value differs significantly from the population value. If this is not the case, the hypothesis is accepted.
- Confidence intervals: The Z-score is also used to calculate confidence intervals. This value of a sample mean can be used to estimate the range of values into which the population value falls with a certain probability.
- Detection of outliers: By defining a threshold, outliers can be easily detected by calculating the Z-score for each data point. Data whose values lie outside a defined range can be classified as outliers.
- Normality tests: The Z-score also makes it possible to check whether data follows a normal distribution. This calculation and the visualization of the distribution in a normal probability diagram can be used to assess whether a normal distribution is present.
The Z-score forms the basis for many statistical applications. It is mainly used for hypothesis tests and for testing the normal distribution.
How to interpret the Z-score?
The Z-score is relatively easy to interpret. To do this, two variables are considered, firstly the sign and secondly the actual value. A positive value means that the data point is above the mean value, while a negative value means that the data point is below the mean value. The size of the Z-score in turn measures how far away the data point is from the mean value. For better comparability, this is measured in standard deviations and not in absolute numbers.
A Z-score of 1 therefore means that the point is above the mean for the data set and is also one standard deviation away. A value of 2 can be interpreted in the same way. This data point is therefore two standard deviations above the mean. Finally, a data point with a Z-score of -1 is below the mean and one standard deviation away. In addition, the Z-score can also be zero, which means that the analyzed data point corresponds exactly to the mean value.
What are the Advantages and Disadvantages of using the Z-score?
The Z-score is a popular tool in the field of statistics that is used to standardize data from different sources and thus make data sets comparable. However, this key figure not only has advantages but also some limitations. In this section, we therefore look at the advantages and disadvantages of the Z-score so that it can be used effectively depending on the application.
Advantages:
- The Z-score provides a simple and standardized measure to assess how far a data point is from the average of the data set.
- This ensures that different data sets can be compared independently and on a standardized scale.
- The Z-score is also a useful way of identifying outliers or extreme values in a data set.
- This metric can be used in numerous applications, such as hypothesis testing, to draw statistical conclusions and decide whether a hypothesis should be rejected.
Disadvantages:
- The Z-score is based on a normal distribution and assumes that the data set follows a normal distribution. In some cases, this assumption may not be true.
- The key figure is based on the average, which can be influenced by outliers. This means that the Z-score itself is also indirectly influenced by outliers.
- Care must be taken when using this key figure for small data sets, as the distribution may not be sufficiently established and therefore no meaningful values are obtained.
What are alternative statistical measures that can be used instead or combined?
Depending on the application, the Z-score may not be the optimal measure or should be supplemented by other key figures for a balanced analysis. The most popular key figures for this are
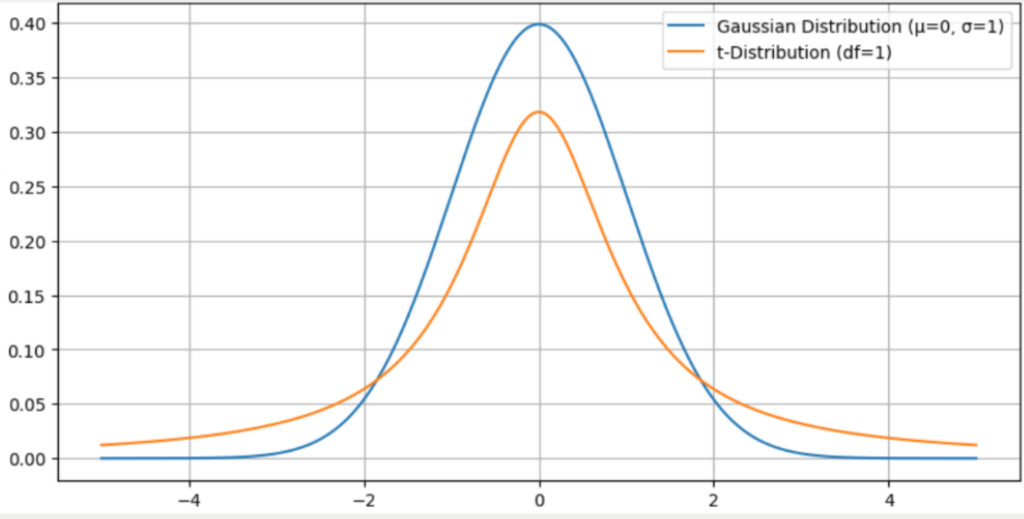
- T-score: This is a similar measure to the Z-score, which also measures the number of standard deviations from the mean. It is generally used for smaller samples where the z-score may not provide good results. The t-distribution differs from the normal distribution in that the outer edges are higher, which makes outliers in a t-distribution more likely.
- Percentiles: Percentiles are a way of categorizing data points based on their relative position within the distribution. For example, the 75th percentile includes all data points that fall below 75% of the data.
- Effect sizes: Effect sizes quantify the extent of the difference between two variables. These are used to compare results between data sets with different measures or scales.
- Confidence intervals: Confidence intervals indicate a range within which the true parameter of the population is expected to fall. These can be used to evaluate estimates and compare the results of studies.
The Z-score is a widely used tool, especially for hypothesis testing. However, it can also be replaced by other measures to compare data sets.
What is the robust Z-score?
The Z-score is based on the assumption that the data set is normally distributed and therefore the mean and standard deviation can be used. In practice, however, data rarely follow a normal distribution and are subject to distortions or have asymmetric distributions. This can lead to misleading results in the interpretation, as the mean and standard deviation are strongly influenced by outliers.
In these cases, the alternative indicator of the robust Z-score has been developed, which is not based on the mean value but on the median, which reacts much less strongly to outliers due to its definition. Instead of the standard deviation, the median absolute deviation (MAD) is calculated, which indicates the mean absolute deviation of the data point from the median. These components result in the following formula:
\(\)\[z_{robust} = \frac{x – \text{Median}}{MAD} = \frac{x – \text{Median}}{\text{Median}(|x_i – \text{Median}|)}\]
This robust Z-score is particularly useful for skewed distributions or distributions that struggle with extreme values. Within a company analysis, this variant could be used, for example, for the salary interpretation, which may no longer follow a normal distribution, as some extreme salaries of top management distort the distribution.
This is what you should take with you
- The Z-score is a key figure in statistics that is used to determine how far a data point is from the mean value of a data set. This distance is measured in standard deviations.
- This key figure is used to standardize data and can also be used to compare data sets on different scales.
- This measure is often used in hypothesis tests and for statistical conclusions. Especially when the population value and the standard deviation can be.
- The Z-score is particularly easy to calculate and interpret. However, it also has its disadvantages, as it is, for example, very dependent on the population parameter and is also sensitive to outliers.
- Other statistical measures can also be used, such as the T-score or confidence intervals. These can be used either as an alternative or in conjunction with the Z-score.

What is the F-Statistic?
Explore the F-statistic: Its Meaning, Calculation, and Applications in Statistics. Learn to Assess Group Differences.

What is Gibbs Sampling?
Explore Gibbs sampling: Learn its applications, implementation, and how it's used in real-world data analysis.

What is a Bias?
Unveiling Bias: Exploring its Impact and Mitigating Measures. Understand, recognize, and address bias in this insightful guide.

What is the Variance?
Explore variance's role in statistics and data analysis. Understand how it measures data dispersion.

What is the Kullback-Leibler Divergence?
Explore Kullback-Leibler Divergence, a vital metric in information theory and machine learning, and its applications.

What is the Maximum Likelihood Estimation?
Unlocking insights: Understand Maximum Likelihood Estimation (MLE), a potent statistical tool for parameter estimation and data modeling.
Other Articles on the Topic of Z-score
The measure can be calculated in Python too using a library like SciPy. Please find the documentation for it here.

Niklas Lang
I have been working as a machine learning engineer and software developer since 2020 and am passionate about the world of data, algorithms and software development. In addition to my work in the field, I teach at several German universities, including the IU International University of Applied Sciences and the Baden-Württemberg Cooperative State University, in the fields of data science, mathematics and business analytics.
My goal is to present complex topics such as statistics and machine learning in a way that makes them not only understandable, but also exciting and tangible. I combine practical experience from industry with sound theoretical foundations to prepare my students in the best possible way for the challenges of the data world.