Pie charts are a popular way to visualize data in a circular format. They are commonly used in business, statistics, and scientific research to help convey complex information in a simple, easy-to-understand way. In this article, we will explore the basics of pie charts, including how to interpret them, when they are used, and how you can draw them in Python.
What is a Pie Chart?
A pie chart is a circular graph that is divided into slices to represent the proportion of each category within a dataset. The size of each slice is proportional to the quantity it represents. Pie charts are typically used to display data that is categorical and where there are relatively few categories, as too many categories can make the chart difficult to read.
How to interpret a Pie Chart?
A pie chart is a popular data visualization technique that visually represents data using slices or wedges of a circle. Each slice in the chart represents a category or a portion of the whole, with the size of the slice proportional to the corresponding data value.
The main purpose of a pie chart is to showcase the distribution or composition of a dataset. The circle represents the entire dataset, and each slice represents a specific category or data point within that dataset. The size of each slice is determined by the proportionate value it represents.
The angle of each slice is calculated based on its value relative to the total value of the dataset. This allows viewers to quickly understand the relative contribution or importance of each category or data point. The larger the slice, the greater its significance in relation to the others.
Colors and labels are used to enhance the understanding of the chart. Different colors are assigned to each slice to make them visually distinct and easier to differentiate. Labels are typically added to each slice, indicating the category or value it represents. These labels can provide additional context and aid in data interpretation.
Pie charts are particularly useful for displaying categorical data with a small number of categories. They are effective in highlighting the distribution or proportionality of the data, making it easier for viewers to grasp the overall patterns or trends at a glance. However, it’s important to note that pie charts may not be suitable for displaying large amounts of data or datasets with too many categories, as it can lead to cluttered visuals and decreased readability.
Which applications use this diagram type?
Pie charts are versatile and can be used in a variety of applications. Some common applications include:
- Business: Pie charts can be used to display market share, revenue breakdown, and expenses.
- Education: This diagram type can be used to show the distribution of grades or the breakdown of student demographics.
- Healthcare: Pie charts can be used to display the prevalence of diseases or the distribution of patient demographics.
- Finance: They can be used to show the allocation of investments, the distribution of assets, or the breakdown of expenses.
- Marketing: The diagram type can be used to display the results of a customer survey or the breakdown of customer demographics.
- Research: Pie charts can be used to display the distribution of data within a sample or the proportion of responses to a survey question.
Overall, pie charts are useful whenever you need to display data that is categorical and where there are relatively few categories. When used correctly, they can be an effective tool for highlighting differences between categories and for comparing different categories to one another.
How to make a pie chart in Matplotlib?
Python is a popular programming language for data visualization. To draw a pie chart in Python, we can use the Matplotlib library. Here is an example code that creates a simple pie chart:

In this code, we first import the matplotlib.pyplot library. We then define the labels for our categories and the sizes of each category. We create a subplot object and then use the pie function to create the pie chart. The labels argument specifies the labels for each slice of the pie, while the sizes argument specifies the size of each slice. The autopct argument specifies the format for the percentage values that are displayed on each slice. Finally, we use the axis function to ensure that the pie chart is circular and then use the show function to display the chart.
What are more advanced calls for working with Pie Charts in Matplotlib?
Certainly! Here’s a section on more advanced calls in Matplotlib that can be used to enhance your pie charts:
- Explode Slices:
You can emphasize specific slices of the pie chart by “exploding” them. To do this, provide a list of values specifying the extent of the slice separation:

- Custom Colors:
Matplotlib allows you to customize the colors of the pie chart slices. You can provide a list of colors to thecolorsparameter:

- Shadow and Start Angle:
You can add a shadow effect to the pie chart by setting theshadowparameter toTrue. Additionally, you can specify the start angle of the first slice using thestartangleparameter:

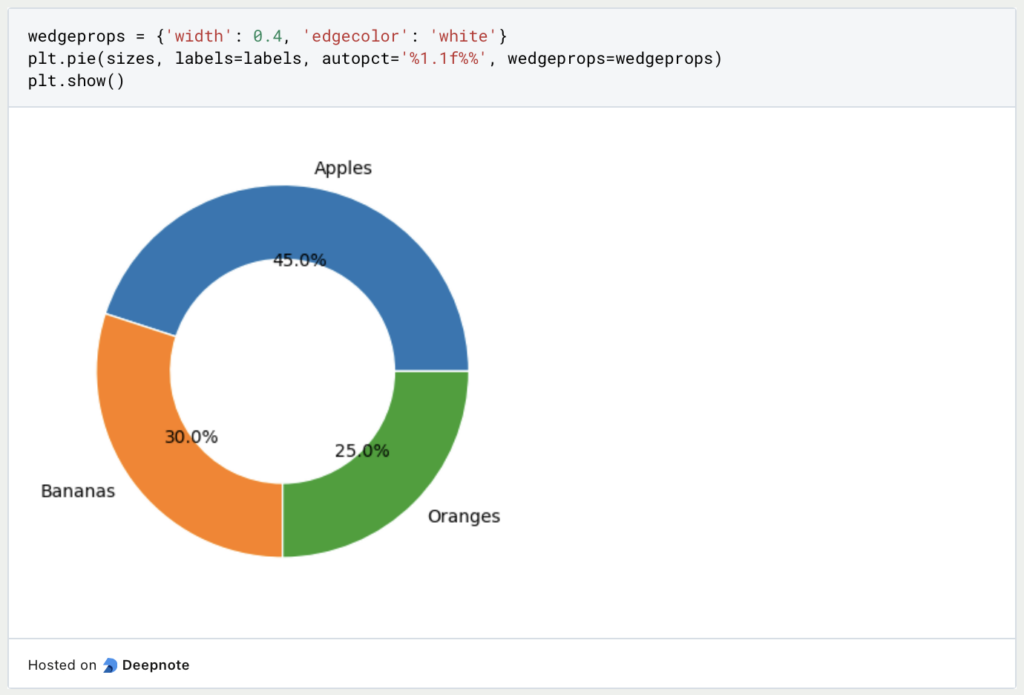
- Donut Chart:
You can create a donut chart by setting thewedgepropsparameter to create an inner circle. This can be achieved by providing a dictionary with the desired properties:
- Adding Annotations:
You can add text annotations to the pie chart to provide additional information. Use thetextpropsparameter to specify text properties such as font size, color, and style:

By utilizing these advanced calls in Matplotlib, you can customize and enhance your chart to effectively represent and communicate your data. Experiment with these options to create visually appealing and informative visualizations.
What types of diagrams are used in Business Intelligence applications?
There are several types of charts used in Business Intelligence (BI) to represent data and help users visualize and analyze information. Here are some of the most common chart types:
- Bar charts: Bar charts are used to compare data across categories or groups and are one of the most common chart types in BI. While they are very similar to histograms, they should not be confused.
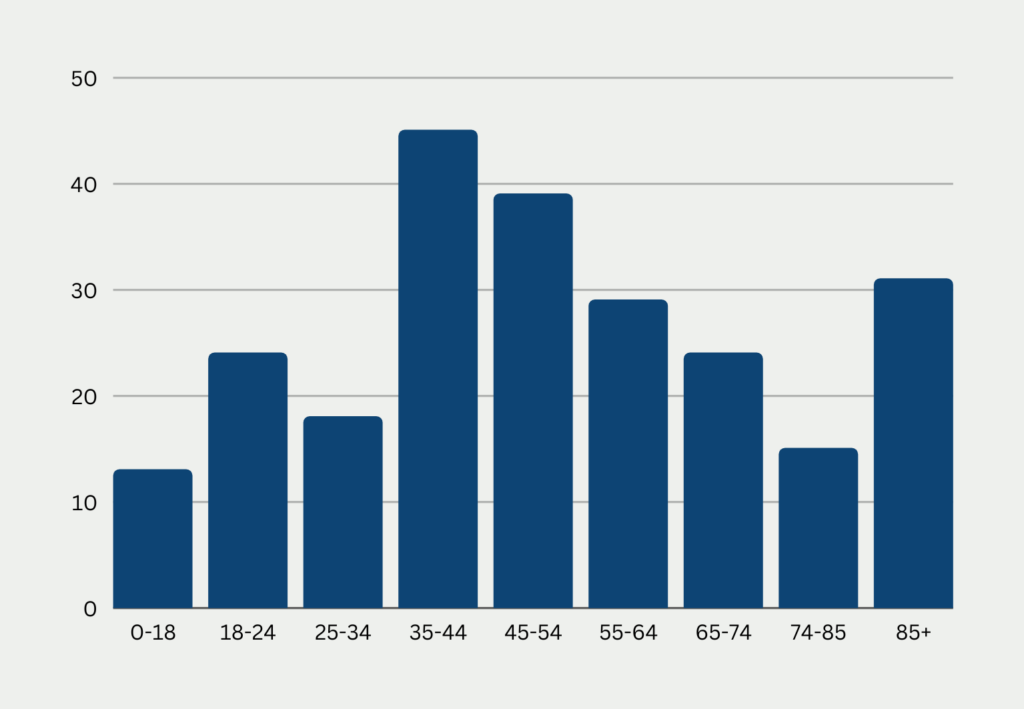
- Histograms: A histogram is a visualization form from the field of statistics that is used to illustrate frequency distributions. It involves counting the data points that fall into a defined group and then displaying their values in individual bars.
- Line charts: Line charts are used to show trends over time and are useful for visualizing changes in data over a period of time.
- Scatter plots: Scatter plots are used to show the relationship between two variables and are commonly used in BI to identify patterns and correlations.
- Heat maps: heat maps are used to represent data in color and are useful for highlighting patterns and trends in large data sets.
- Tree charts: used to represent hierarchical data, tree charts are used in BI to show the size and composition of different categories of data.
- Pie charts: Pie charts are used to show the composition of data and are suitable for showing proportions and percentages.
- Sankey charts: Sankey diagrams are used to visualize the flow of data or processes and are useful for understanding complex systems and processes.
- Bubble charts: Used to show the relationship between three variables, bubble charts are often used in BI to identify patterns and correlations.
These are just a few examples of the many types of charts used in business intelligence. The choice of chart type depends on the data to be analyzed, the goals of the analysis, and the user’s preference.
What are limitations of Pie Charts?
Pie charts are a popular choice for visualizing data due to their simplicity and ability to convey relative proportions. However, like any data visualization technique, pie charts have limitations that should be considered. Understanding these limitations is crucial for making informed decisions when choosing the appropriate chart type for your data. In this section, we will explore the limitations of pie charts and discuss important considerations to keep in mind when using them. By understanding these limitations, you can ensure that your visualizations accurately and effectively communicate your data insights.
Here’s a section on the limitations and considerations of pie charts:
- Limited Data Comparison: Pie charts are best suited for displaying data with a few categories. If you have too many categories, the chart can become cluttered and difficult to interpret. It may be challenging to make accurate comparisons between smaller slices.
- Difficulty in Comparing Slices: It can be challenging to accurately compare the sizes of different slices in the chart. Our visual perception may struggle to perceive differences in angles and areas, leading to potential misinterpretations.
- Misleading Representations: The use of 3D effects, shadows, or exploded slices in pie charts can distort the visual perception of the data. These embellishments can make it difficult to accurately interpret the relative proportions of the categories.
- Data Ordering: The order of the categories in a pie chart does not convey any inherent meaning. Rearranging the order can lead to different visual representations, potentially influencing the interpretation of the data.
- Limited Data Labels: They can accommodate data labels within the slices, but it becomes challenging to fit longer labels or multiple lines of text. This limitation can make it harder to provide detailed information for each category.
- Alternative Representations: Depending on the nature of the data and the message you want to convey, alternative chart types like bar charts or stacked bar charts might provide clearer and more effective visualizations.
- Accessibility Considerations: Pie charts may not be suitable for individuals with visual impairments or colorblindness. Ensure that you provide alternative text or consider using alternative visualizations to make the data accessible to a wider audience.
While pie charts can be useful in certain scenarios, it’s important to be aware of their limitations and consider alternative chart types when necessary. Always strive to choose the most appropriate visualization that effectively represents your data and facilitates clear communication.
This is what you should take with you
- Pie charts are a commonly used visualization tool for representing relative proportions or percentages.
- They offer a quick and intuitive way to understand the distribution of categories in a dataset.
- Pie charts can effectively highlight a single dominant category or compare a few distinct categories.
- However, pie charts have limitations and considerations to keep in mind, such as limited length of labels or the missing order in the data.
- By understanding these limitations and being mindful of the design choices, you can create pie charts that effectively communicate your data insights.

What is the Univariate Analysis?
Master Univariate Analysis: Dive Deep into Data with Visualization, and Python - Learn from In-Depth Examples and Hands-On Code.

What is OpenAPI?
Explore OpenAPI: A Comprehensive Guide to Building and Consuming RESTful APIs. Learn How to Design, Document, and Test APIs.

What is Data Governance?
Ensure the quality, availability, and integrity of your organization's data through effective data governance. Learn more here.

What is Data Quality?
Ensuring Data Quality: Importance, Challenges, and Best Practices. Learn how to maintain high-quality data to drive better business decisions.

What is Data Imputation?
Impute missing values with data imputation techniques. Optimize data quality and learn more about the techniques and importance.
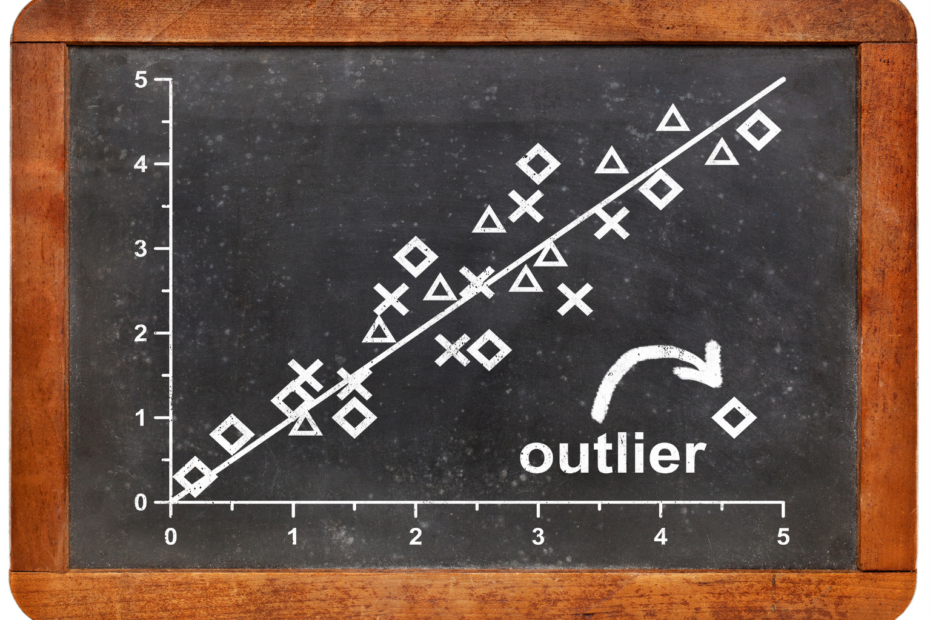
What is Outlier Detection?
Discover hidden anomalies in your data with advanced outlier detection techniques. Improve decision-making and uncover valuable insights.
Other Articles on the Topic of Pie Charts
Please find a detailed article on pie charts in Matplotlib here.

Niklas Lang
I have been working as a machine learning engineer and software developer since 2020 and am passionate about the world of data, algorithms and software development. In addition to my work in the field, I teach at several German universities, including the IU International University of Applied Sciences and the Baden-Württemberg Cooperative State University, in the fields of data science, mathematics and business analytics.
My goal is to present complex topics such as statistics and machine learning in a way that makes them not only understandable, but also exciting and tangible. I combine practical experience from industry with sound theoretical foundations to prepare my students in the best possible way for the challenges of the data world.