Time series data is a type of data where observations are recorded over time at equally spaced intervals. It is commonly used in various fields such as finance, economics, engineering, and environmental sciences, among others. Time series data differs from other types of data because it includes a temporal dimension that adds an extra level of complexity to the analysis. This complexity arises from the fact that time series data is often characterized by trends, seasonality, and other forms of temporal dependence, which can complicate the process of modeling and predicting future values.
In this article, we will discuss the key concepts and methods used in time series analysis, as well as some common applications and challenges associated with this type of data.
What is Time Series Data?
Time series data is a specific type of data where observations are recorded at regular intervals over a continuous time period. Unlike cross-sectional data, which captures information at a particular point in time, time series data provides insights into how variables change over time.
It possesses unique characteristics that make it distinct from other types of data. These characteristics include:
- Temporal Order: Time series data is inherently ordered, with observations arranged in chronological order. This temporal aspect enables the analysis of trends, patterns, and dependencies over time.
- Time-dependent Relationships: Time series data often exhibits dependencies, such as autocorrelation, where the value of a variable at one time point is related to its past values. Understanding these dependencies is crucial for accurate modeling and forecasting.
- Seasonality and Trends: Time series data frequently exhibits recurring patterns and trends, which can be attributed to various factors such as seasonality (e.g., daily, weekly, or annual patterns) or long-term trends (e.g., upward or downward movements over time).
- Irregular Sampling Intervals: While time series data is commonly collected at regular intervals, it can also have irregular sampling intervals. This irregularity introduces challenges in data preprocessing and analysis.
- Time-dependent Variation: Time series data often displays varying levels of variability or volatility over time. Identifying and modeling this variation is essential for understanding the inherent uncertainty in the data.
The analysis of time series data plays a vital role in various domains, including finance, economics, climate science, sales forecasting, and many more. By examining historical patterns and relationships, time series analysis enables us to make informed predictions, detect anomalies, and gain insights into underlying dynamics.
Why is Time Series Analysis important?
Time series analysis is a powerful tool for understanding and extracting insights from data that evolves over time. It holds significant importance across various domains and industries due to the following reasons:
- Trend Identification: Time series analysis helps in identifying trends and patterns within the data. By examining historical data points, it becomes possible to detect upward or downward trends, enabling businesses to make informed decisions and predictions about future outcomes.
- Forecasting and Prediction: Time series analysis allows for accurate forecasting and prediction of future values based on historical data patterns. This is particularly valuable in fields such as sales forecasting, demand prediction, stock market analysis, and resource planning, where accurate predictions are crucial for effective decision-making.
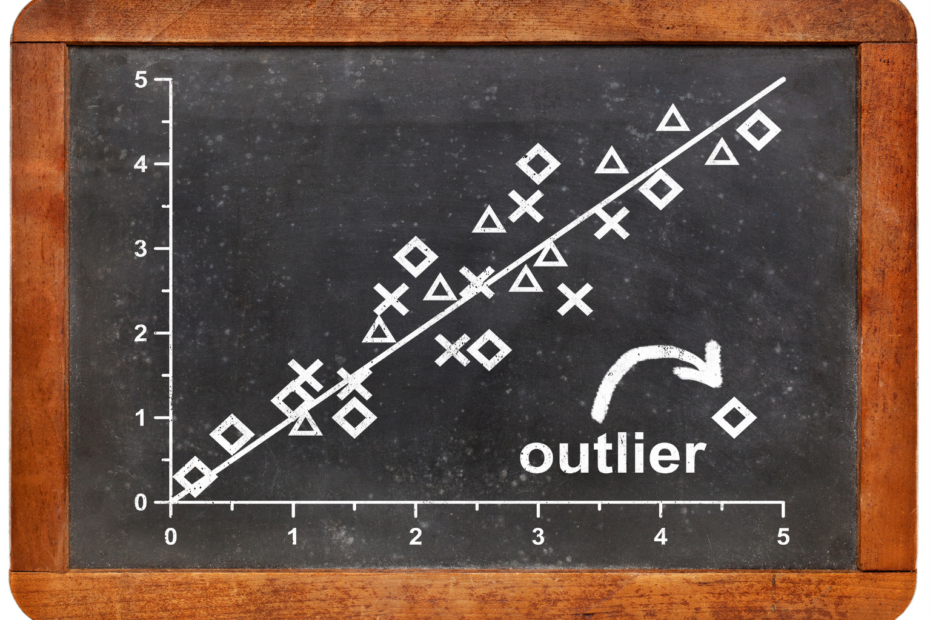
- Anomaly Detection: Time series analysis helps identify anomalies or outliers in data. These anomalies may indicate critical events or unusual behaviors that require attention. By detecting such anomalies early, businesses can take timely actions to mitigate risks or exploit new opportunities.
- Seasonality Analysis: Many time series data exhibits seasonal patterns, such as daily, weekly, monthly, or yearly variations. Time series analysis enables the identification and understanding of these seasonal patterns, allowing businesses to adjust their strategies accordingly. For example, retailers can plan promotions based on weekly or yearly shopping trends.
- Performance Evaluation: Time series analysis provides a means to evaluate the performance of a system or process over time. By tracking relevant metrics and comparing them against historical data, businesses can assess the effectiveness of their strategies, identify areas for improvement, and optimize their operations.
In conclusion, time series analysis is of great importance in understanding and leveraging data that evolves over time. By analyzing historical patterns, identifying trends, and making accurate predictions, businesses can gain valuable insights, make informed decisions, optimize their operations, and stay competitive in today’s dynamic and evolving market.
How to preprocess time series data?
Data preprocessing plays a crucial role in time series analysis to ensure accurate and reliable results. It involves various techniques to address common challenges encountered in time series data, including handling missing values, smoothing, and resampling.
One common challenge is missing values, which can adversely affect the analysis. Imputation techniques such as forward fill, backward fill, or interpolation can be used to address missing values. Alternatively, time points with significant missing values can be removed if accurate imputation is not feasible.
Smoothing techniques are employed to reduce noise and variability in time series data, revealing underlying patterns. Moving averages, such as the simple moving average or exponentially weighted moving average, are commonly used for smoothing. These techniques involve calculating the average of a sliding window of data points to highlight long-term trends and minimize short-term fluctuations.
Resampling involves changing the frequency of the time series data. Upsampling increases the frequency by interpolation to capture more frequent or granular observations, while downsampling decreases the frequency by aggregating multiple observations into a single data point. Resampling helps align data to a common frequency or reduce computational complexity.
Handling outliers is essential in time series analysis. Outliers are extreme values that deviate significantly from the expected pattern. Techniques like Z-score, median absolute deviation (MAD), or robust statistical methods can be employed to identify and handle outliers appropriately.
Normalization and scaling are important to ensure variables with different scales have a comparable influence on the analysis. Normalization techniques like min-max scaling, z-score normalization, or decimal scaling can be applied to bring variables to a consistent scale.
Feature engineering is another important step in data preprocessing for time series analysis. It involves creating new variables or transforming existing variables to enhance the predictive power of the model. Techniques such as lagging variables, differencing, or creating rolling statistics can be utilized to extract meaningful features from the time series data.
By performing effective data preprocessing, including handling missing values, smoothing, resampling, handling outliers, normalization, and feature engineering, time series data can be properly prepared for further analysis. These preprocessing techniques contribute to more accurate and meaningful insights from time series analysis.
Which models are used to forecast a time series into the future?
When it comes to time series forecasting, various models can be used depending on the characteristics of the data and the specific forecasting task. Here are some commonly used models:
- Autoregressive Integrated Moving Average (ARIMA): ARIMA is a popular model for univariate time series forecasting. It combines autoregressive (AR), differencing (I), and moving average (MA) components. ARIMA models are capable of capturing both the trend and seasonality in the data.

- Seasonal ARIMA (SARIMA): SARIMA is an extension of the ARIMA model that incorporates seasonality in addition to the trend. It is useful when the data exhibits recurring patterns over specific time intervals, such as daily, monthly, or yearly.
- Exponential Smoothing Methods: Exponential smoothing methods include models like Simple Exponential Smoothing (SES), Holt’s Linear Exponential Smoothing, and Holt-Winters’ Seasonal Exponential Smoothing. These models are suitable for forecasting time series with or without trend and seasonality. They assign exponentially decreasing weights to older observations, giving more importance to recent data.
- Vector Autoregression (VAR): VAR is a multivariate time series model that captures the relationship between multiple variables. It allows for the analysis and forecasting of the interdependencies between these variables. VAR models are useful when the forecast of one variable depends on the lagged values of other variables.
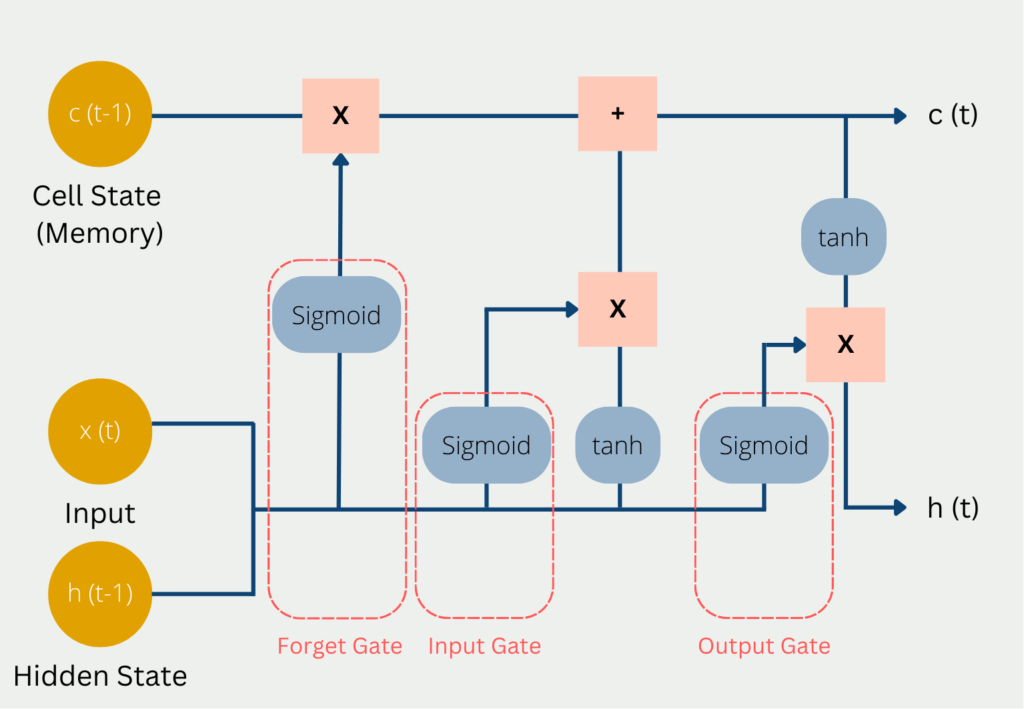
- Long Short-Term Memory (LSTM) Networks: LSTM is a type of recurrent neural network (RNN) that is effective in capturing long-term dependencies and patterns in sequential data. It can be used for time series forecasting by learning from historical patterns and making predictions based on the learned context.
- Prophet: Prophet is a time series forecasting model developed by Facebook. It is designed to handle time series data with multiple seasonality components, including daily, weekly, monthly, and yearly patterns. Prophet incorporates various components such as trend, seasonality, and holiday effects to make accurate forecasts.
- Gaussian Processes (GP): GP models are probabilistic models that can capture non-linear dependencies in time series data. They are flexible and can handle uncertainty estimation. GP models are suitable when the underlying data generation process is believed to be smooth and continuous.
- State Space Models: State space models, such as the Kalman filter and its extensions, are used for modeling dynamic systems with hidden states. These models can capture complex relationships between observed variables and latent variables, making them useful for time series forecasting.
Each of these models has its strengths and limitations, and the choice of model depends on factors such as the nature of the data, the presence of trend or seasonality, the available computational resources, and the desired level of interpretability. It is often beneficial to experiment with multiple models and select the one that best fits the data and provides accurate forecasts for the specific forecasting task at hand.
How to evaluate Time Series models?
The evaluation of time series models is essential to understand the quality and accuracy of predictions. The most common approach is to use historical data to estimate the model parameters and test its predictive power on a separate set of data. The following evaluation techniques are commonly used for time series models:
- Mean Squared Error (MSE): This measures the difference between predicted and actual values. The smaller the value of MSE, the better the model.
- Root Mean Squared Error (RMSE): This is the square root of the MSE and gives a measure of the typical error of the model in the same units as the data.
- Mean Absolute Error (MAE): This measures the absolute difference between predicted and actual values. It is less sensitive to outliers than MSE.
- Mean Absolute Percentage Error (MAPE): This measures the percentage difference between predicted and actual values.
- Symmetric Mean Absolute Percentage Error (SMAPE): This is similar to MAPE, but it takes the average of the percentage difference between predicted and actual values.
- Theil’s U-Statistic: This measures the relative accuracy of the forecast compared to the naïve forecast, which is the forecast for the next period equal to the value of the current period.
- Akaike Information Criterion (AIC) and Bayesian Information Criterion (BIC): These are measures of the goodness-of-fit of a model that also take into account the number of parameters in the model. Lower values of AIC and BIC indicate better models.
- Forecast Error Variance Decomposition (FEVD): This measures the contribution of each shock to the forecast error variance.
- Diebold-Mariano test: This is a statistical test used to compare the forecast accuracy of two models.
It is important to note that the best evaluation metric depends on the problem and the data. A good practice is to compare different evaluation metrics and choose the one that is most relevant for the specific application.
What are the challenges and considerations when working with Time Series Data?
Analyzing and forecasting time series data brings forth unique challenges and considerations. These factors play a crucial role in understanding and making predictions based on time-dependent data. Here are some key aspects to keep in mind:
Time Dependence: Time series data relies on the relationship between past and present observations. Each data point is influenced by its temporal context, and this dependency calls for specialized modeling techniques.
Seasonality and Trend: Many time series exhibit recurring patterns, such as daily, weekly, or yearly fluctuations. Identifying and accounting for these patterns, as well as capturing long-term trends, are essential for accurate forecasting.
Non-Stationarity: Time series data often undergoes changes in statistical properties over time, such as mean and variance. These changes can arise from various factors, requiring transformations to make the data stationary for modeling purposes.
Missing Data: Time series data might have gaps or missing values due to different reasons. Addressing missing data is critical to maintain the integrity of the analysis and forecasts. Techniques like interpolation or imputation can be used to handle missing values.
Outliers and Anomalies: Anomalies and outliers, which are data points significantly deviating from the expected pattern, can distort models and impact forecast accuracy. Robust outlier detection methods are essential to ensure reliable results.
Variable Interactions: In multivariate time series analysis, understanding the interactions between variables is crucial. Variables may exhibit complex dependencies and relationships, requiring careful modeling to capture these interactions accurately.
Computational Complexity: Analyzing and modeling time series data can be computationally intensive, particularly with large datasets or complex models. Employing efficient algorithms and sufficient computational resources is necessary to handle the computational demands.
Validation and Evaluation: Validating and evaluating time series models pose unique challenges due to the sequential nature of the data. Techniques like walk-forward validation or rolling origin validation can be employed to assess the model’s performance on unseen data.
Interpretability: While complex models might provide accurate forecasts, their interpretability can be limited. Finding a balance between model complexity and interpretability is important, considering the specific needs and requirements of the analysis.
By addressing these challenges and making informed decisions regarding data preprocessing, modeling techniques, and evaluation methods, analysts can effectively navigate time series data and extract meaningful insights and accurate forecasts.
Which applications use Time Series analysis?
Time series analysis is a powerful tool that has a wide range of applications across various industries. Here are some examples:
- Finance: Time series analysis is widely used in finance for forecasting stock prices, foreign exchange rates, and interest rates.
- Economics: Time series analysis is used in economics to analyze macroeconomic variables such as gross domestic product, inflation, and unemployment rates.
- Marketing: Time series analysis can be used to analyze sales data, identify trends, and forecast future sales.
- Healthcare: Time series analysis can be used to analyze medical data, such as patient vital signs, and to identify trends and patterns that can help in diagnosis and treatment.
- Environmental science: Time series analysis can be used to analyze data on climate change, including temperature and precipitation patterns.
- Transportation: Time series analysis can be used to forecast traffic patterns and optimize transportation routes.
- Manufacturing: Time series analysis can be used to identify trends and patterns in production data, and to forecast demand for products.
- Social sciences: Time series analysis can be used to analyze data on crime rates, population demographics, and other social phenomena.
Overall, time series analysis provides a valuable tool for understanding complex systems and making informed decisions based on historical patterns and trends.
This is what you should take with you
- Time series data is a type of data that is ordered chronologically.
- It can be analyzed using various time series models, such as ARIMA, SARIMA, and exponential smoothing.
- Preprocessing of time series data involves handling missing values, and outliers, and scaling the data.
- Evaluation of time series models can be done using various techniques such as mean squared error, root mean squared error, and mean absolute percentage error.
- Time series analysis has various applications such as in finance, economics, weather forecasting, and sales forecasting.
- Accurate time series forecasting can help businesses make better decisions and improve their overall performance.

What is OpenAPI?
Explore OpenAPI: A Comprehensive Guide to Building and Consuming RESTful APIs. Learn How to Design, Document, and Test APIs.

What is Data Governance?
Ensure the quality, availability, and integrity of your organization's data through effective data governance. Learn more here.

What is Data Quality?
Ensuring Data Quality: Importance, Challenges, and Best Practices. Learn how to maintain high-quality data to drive better business decisions.

What is Data Imputation?
Impute missing values with data imputation techniques. Optimize data quality and learn more about the techniques and importance.
What is Outlier Detection?
Discover hidden anomalies in your data with advanced outlier detection techniques. Improve decision-making and uncover valuable insights.

What is the Bivariate Analysis?
Unlock insights with bivariate analysis. Explore types, scatterplots, correlation, and regression. Enhance your data analysis skills.
Other Articles on the Topic of Time Series Data
InfluxDB is an optimised database for Time Series Data. You can find their homepage here.

Niklas Lang
I have been working as a machine learning engineer and software developer since 2020 and am passionate about the world of data, algorithms and software development. In addition to my work in the field, I teach at several German universities, including the IU International University of Applied Sciences and the Baden-Württemberg Cooperative State University, in the fields of data science, mathematics and business analytics.
My goal is to present complex topics such as statistics and machine learning in a way that makes them not only understandable, but also exciting and tangible. I combine practical experience from industry with sound theoretical foundations to prepare my students in the best possible way for the challenges of the data world.