Online Analytical Processing (OLAP) is a technology for organizing large, cluttered databases so that they can be analyzed from multiple perspectives for business intelligence applications.
How does Online Analytical Processing work?
Online Analytical Processing is used to optimize databases for data mining or business intelligence and accelerate queries. In this process, the data from the relational tables are restructured and stored separately by dimension in so-called cubes. These cubes are formed to contain the most frequently queried dimensions and values that many business analysts need.
In the architecture, this results in two databases:
- Data Warehouse: Here the original tables and rows are stored as they came from the source system. If specific rows need to be accessed in detail, the data warehouse can be queried. For example, a table in the data warehouse includes all orders in detail. Each row here corresponds to exactly one order or even one order item.
- OLAP – Database: These databases try to aggregate frequently used columns (dimensions) and keep them in memory. This is especially important for business intelligence applications where aggregated key figures are calculated. For the management, for example, the monthly turnover is decisive, so not every single order has to be kept in a row.
What is the OLAP Cube?
As soon as data sets are to be displayed in diagrams, we need two different concepts: Dimensions and values. The dimension is the basis for every evaluation and stands for an independent value. If our data set contains the sales data from the last year, for example, there is the dimension “order date”, “customer number” or “product number”. In contrast, there are the values, which are concrete numbers we can count on in the chart, for example, the sales quantity or the turnover.
The combination of at least one dimension and one key figure then creates charts. For example, a bar chart could use the customer number as the dimension and the sales volume as the value. The result is a view from which the product with the highest sales can be read. In short, this is how Business Intelligence works. Various dimensions and values are combined into diagrams, which should help to answer specific questions from the business environment.
Conventional databases are not optimized for such queries and therefore lead to slow and inefficient transactions, especially when several dimensions are queried simultaneously. Here is a concrete example that shows the problem:
For a sales evaluation, we need to bring together three dimensions, a customer dimension (e.g. the customer name), a product dimension (e.g. the product name) and a time dimension (e.g. order date). All of this information is stored in different database tables due to the normalization of a relational database. To bring them together, we need to work with join operations in SQL.

For this reason, OLAP uses the so-called cube. In it, several dimensions can be represented as axes of the cube. The values are then a concrete point in the cube space. So we can represent the three dimensions of customer, product, and time as cube axes.
All business intelligence users can then access this cube structure and make queries. This avoids the multiple join queries to the database and makes transactions much faster and more efficient. Of course, more than three dimensions can be included in the cube. In this case, the cube serves only as illustration support and is not to be understood as an actual cube. From a fourth dimension, for example, the whole thing can no longer be represented as a cube, but Online Analytical Processing can still be used.

Which Operations are made possible by the Cube?
For analysts, the division into cubes opens up completely new possibilities that were not possible with conventional relational databases, or only with a great deal of computational effort. Overall, the operations with an OLAP cube can be divided into five categories:
- Slicing: In slicing, only a part of the cube (a slice) is considered by setting one of the dimensions to a fixed value. In our example, this could be a specific product for which all customers and all order times are considered.
- Dicing: Dicing is more constrained than slicing in that it sets more than one dimension. For example, we could look at all products for a particular customer in the month of June 2022, so the product dimension would still be flexible, but the customer and order date dimensions would be fixed.
- Drill-down / Drill-up: In this category, the analyst is given the option to drill down from the aggregate view to a detailed level (drill-down) or to drill up from a detailed level to an aggregate level (drill-up). If you first look at the sales for an entire month and then switch to a view that lists the sales per day, you are doing a drill-down.
- Roll-up: In this case, all values of one dimension are aggregated. For example, if the company’s sales go back three years, the complete sales for the last three years are added up and output.
- Pivot: This category is somewhat abstract in that it gives the analyst the opportunity to think of new ideas and roll the dice, bringing a new, possibly neglected, dimension to the fore. In business intelligence, for example, it is very common to look at sales over time. However, an OLAP cube can also bring the view of individual customers or products back to the foreground.
What are the Advantages and Disadvantages of using OLAP?
The use of OLAP has made it possible for frequent queries to run much more flexibly and efficiently than they still do on classic, relational tables, which of course are not designed for this purpose. In addition, they also provide completely new perspectives on the data in business intelligence through the operations offered by an OLAP Cube.

There are only a few points that speak against the use of Online Analytical Processing, nevertheless, the spread of OLAP is still very low. This is mainly due to the fact that the knowledge about OLAP is not yet as widespread as it is for example with SQL, which is now taught in almost every further education or study. Therefore, personnel must first be trained or the know-how must be purchased at a high price.
As for the actual functionality of Online Analytical Processing, the analysis is limited only to data that can be represented numerically. Otherwise, they cannot be represented in the cube’s coordinate system. For text data from social media mining, for example, numerical representations must first be found in order to use OLAP.
What are the different Types of Online Analytical Processing?
Online Analytic Processing Systems can be divided into a total of three different types. These are:
- Multidimensional Online Analytical Processing (MOLAP): This is the most commonly used form, which forms multidimensional cubes. Although the formation of the cubes takes a relatively long time, the queries are very fast and efficient. This form is particularly suitable for numeric fields.
- Relational Online Analytical Processing (ROLAP): This type does away with the cubes and instead works directly on relational tables. During the ETL process, the data warehouse is supplied with aggregation tables. These can be queried using SQL.
- Hybrid Online Analytical Processing (HOLAP): This is the combination of the previous two types. Part of the data is stored in a traditional MOLAP cube and the remaining part is stored in a ROLAP store.
OLTP and OLAP in Comparison
The two abbreviations OLAP (for Online Analytical Processing) and OLTP (for Online Transaction Processing) are often mistakenly associated with each other because the names have a similar structure. In fact, however, the terms do not have much in common at all but describe different concepts.
Online Transaction Processing (OLTP) describes systems that specialize in the fast processing of transactions. The main focus is on making it relatively easy for the relevant people on the front end to process their transactions, for example at the checkout.
Online Analytical Processing (OLAP), on the other hand, is a platform for simpler data analysis in databases. It is therefore mainly used in the backend by business analysts or data scientists to analyze business data and find partly complex correlations that can contribute to the further development of the company.
From a technical point of view, the differences become even more obvious, as the following points compiled by IBM show:
- OLTP queries are usually based on individual data records for processing a transaction, whereas OLAP queries a large number of data records.
- In Online Transaction Processing, response time plays a major role, whereas, in Online Analytical Processing, the analyses are not time-relevant and can take longer in many cases.
- In Online Analytical Processing, the data is not modified but merely analyzed. Online Transaction Processing modifies the database with each incoming transaction.
- The storage requirements of OLTP are comparatively small because, although many transactions are stored, they have a clear structure and a limited number of columns. OLAP, on the other hand, processes large amounts of data, as it is not uncommon for information to come from different databases and be merged.
This is what you should take with you
- Online Analytical Processing is a technology for organizing large databases for use in business intelligence.
- The dimensions and values are organized in a so-called OLAP cube. This results in different operations for the analyst and new views of the data.
- The use of OLAP primarily offers efficiency advantages in data retrieval compared to traditional databases.

What is the Univariate Analysis?
Master Univariate Analysis: Dive Deep into Data with Visualization, and Python - Learn from In-Depth Examples and Hands-On Code.

What is OpenAPI?
Explore OpenAPI: A Comprehensive Guide to Building and Consuming RESTful APIs. Learn How to Design, Document, and Test APIs.

What is Data Governance?
Ensure the quality, availability, and integrity of your organization's data through effective data governance. Learn more here.

What is Data Quality?
Ensuring Data Quality: Importance, Challenges, and Best Practices. Learn how to maintain high-quality data to drive better business decisions.

What is Data Imputation?
Impute missing values with data imputation techniques. Optimize data quality and learn more about the techniques and importance.
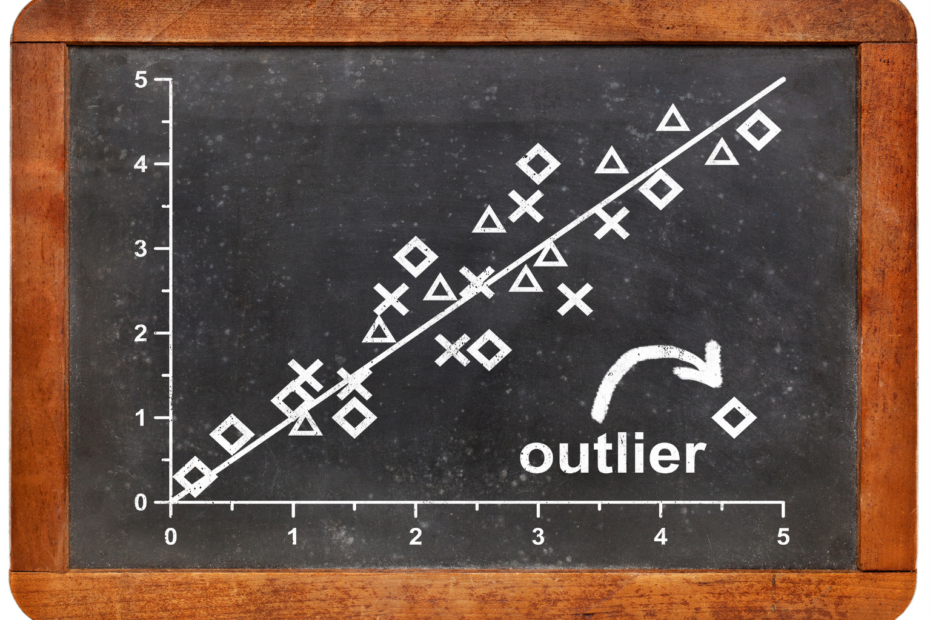
What is Outlier Detection?
Discover hidden anomalies in your data with advanced outlier detection techniques. Improve decision-making and uncover valuable insights.
Other Articles on the Topic of OLAP
- A detailed overview of Online Analytical Processing can also be found at Microsoft.

Niklas Lang
I have been working as a machine learning engineer and software developer since 2020 and am passionate about the world of data, algorithms and software development. In addition to my work in the field, I teach at several German universities, including the IU International University of Applied Sciences and the Baden-Württemberg Cooperative State University, in the fields of data science, mathematics and business analytics.
My goal is to present complex topics such as statistics and machine learning in a way that makes them not only understandable, but also exciting and tangible. I combine practical experience from industry with sound theoretical foundations to prepare my students in the best possible way for the challenges of the data world.