Data mining includes all systematic processes to identify correlations or dependencies in data sets, which in turn can be used for business applications.
Data mining combines findings and methods from a wide range of disciplines, such as mathematics, computer science, and statistics. In science, it is an indispensable component of large-scale surveys or experiments in order to be able to prove the results obtained in terms of data technology or to be able to recognize patterns in the experimental data. Since large amounts of data are now also generated in many companies, such methods are also being used more and more in the business environment.
Why is Data Mining important?
Many companies already use business analytics and visualize their data with the help of business intelligence tools such as Power BI or Tableau. These tools are a good way to keep track of changes in key performance indicators such as sales, profits, or inventories. However, pure business intelligence does not allow conclusive statements to be made about how these changes can be explained.
Data mining helps to explain the obvious changes in the data and to understand the backgrounds that may not seem clear even to the people involved at first glance. For example, algorithms could be used to find out whether an observed increase in sales is ultimately due to a marketing campaign, lowered prices, or the modernization of the web store front end. Possible positive correlations between the three measures can only be found using dedicated data mining methods.
What are the different types of Data Mining?
Depending on the type of data to be examined, there are different approaches and algorithms that can be used. This is also largely dependent on which context exists in the data or is at least suspected:
- Classification: If individual data points are to be assigned to different categories, algorithms such as decision trees or random forests can help. They are able to learn the classification rules and features independently from the data.
- Clustering: This method is relatively similar to classification but not the same. In clustering, individual data sets are assigned to clusters if they share common characteristics. In k-means clustering, for example, only the number of clusters to be searched must be specified and the algorithm then makes the assignment independently.
- Regression: This method attempts to use the data set to calculate new data points based on given variables. This can be used, for example, to find out how large the influence of a variable is on the element to be explained. Examples of this are linear or logistic regression.
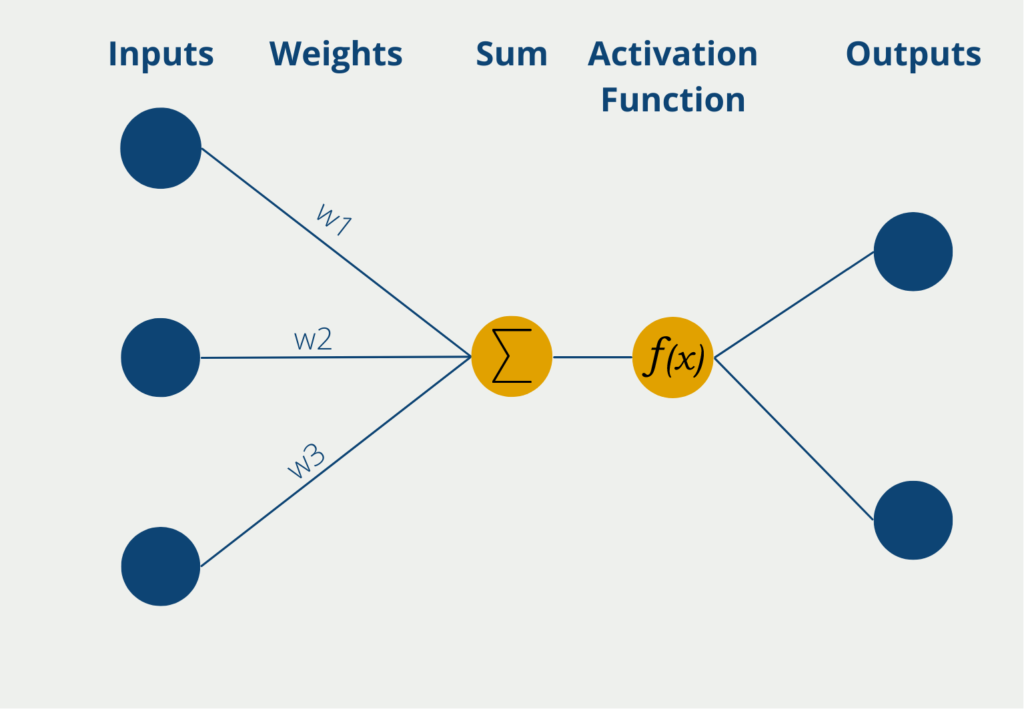
- Neural Networks: These algorithms try to take advantage of how the human brain works to learn complex relationships from data sets and apply them to new data. Depending on how these networks are structured in detail, a distinction is made between different types, such as a Convolutional Neural Network or a Recurrent Neural Network.
What are the advantages of Data Mining?
Within the business environment, there are several benefits that can be achieved using data mining:
- Effective marketing and sales strategies: With the help of data mining, customer behavior can be better understood or certain customer segments can be formed. As a result, marketing or sales measures can be better tailored to customers and thus also lead to higher success rates.
- Faster customer service: Targeted analysis of incoming service requests can automate customer service processes and thus relieve human colleagues. This means customers’ questions can be answered directly and long waiting times can be avoided.
- Prevention of production downtimes: The evaluation of production data can lead to algorithms that detect potential problems and impending failures in the production process at an early stage. If these are known before they occur, targeted repairs or interventions can prevent the machine from breaking down.
- Saving costs: By evaluating business processes, inefficiencies, and cost-intensive process steps can be identified and optimized. As a result, waiting times or errors can possibly be avoided, leading to cost savings.
What challenges does Data Mining face?
Data mining is the process of discovering useful patterns and insights from large data sets. It involves analyzing data from multiple perspectives and synthesizing it into useful information that can be used to make informed decisions. However, data mining also presents a number of challenges. Some of the challenges of data mining include:
- Data quality issues: Data mining relies on high-quality data to produce accurate insights. If the data is incomplete, inaccurate, or inconsistent, the results of data mining may not be reliable.
- Privacy concerns: With the increase in data breaches and privacy regulations, data mining also faces the challenge of ensuring that personal data is protected. Data scientists need to be aware of potential privacy concerns and take steps to anonymize or de-identify sensitive data.
- Data complexity: As data sets become larger and more complex, it becomes more difficult to find meaningful patterns and insights. Data scientists must have the tools and techniques to effectively manage and analyze complex data.
- Technical challenges: Data mining often requires a significant amount of computing power and specialized software tools. Data scientists must have the technical skills to use these tools effectively and efficiently.
- Business understanding: Data mining is not just a technical process; it also requires a deep understanding of the business domain and the problem to be solved. Data Scientists must have the business acumen to identify the relevant variables and insights that drive business value.
To meet these challenges, Data Scientists must possess a combination of technical and business skills, as well as a deep understanding of statistical concepts and data mining techniques. They also need to stay abreast of the latest trends and tools.
What is the difference between Data Mining and Machine Learning?
Data mining and machine learning are two different but related areas of data analysis. Data mining uses a variety of statistical and computational techniques to extract patterns and insights from large data sets. Machine learning, on the other hand, is a subfield of artificial intelligence (AI) that uses statistical algorithms and models to allow machines to learn from data without being explicitly programmed.
While there is some overlap between the two fields, there are also some important differences:
- Scope: Data mining generally involves finding patterns and relationships in large data sets. At the same time, machine learning focuses on developing algorithms and models that can learn from data to make predictions or classifications.
- Techniques: Data mining often includes techniques such as clustering, association rule mining, and anomaly detection, while machine learning typically includes techniques such as supervised learning, unsupervised learning, and reinforcement learning.
- Applications: Data mining is commonly used in fields such as marketing, finance, and healthcare to identify patterns and relationships that can inform decision-making, while machine learning is used in a wide range of applications such as image recognition, natural language processing, and predictive maintenance.
What tools are used in the data mining environment?
Data mining is a complex process of examining and analyzing large data sets to uncover hidden patterns, trends, and relationships. To achieve this, data mining experts turn to various tools that facilitate the extraction of valuable insights from data. Some of the most commonly used tools are:
- RapidMiner: This open-source data mining tool offers a range of features, including data preparation, predictive analytics, and machine learning.
- IBM SPSS Modeler: This tool provides users with a range of analytics capabilities, including predictive modeling, decision trees, and neural networks.
- KNIME Analytics Platform: This open-source data analytics tool offers a wide range of features, including data blending, machine learning, and text mining.
- SAS Enterprise Miner: This tool is a comprehensive solution that supports a variety of analysis techniques, including decision trees, neural networks, and regression.
- Orange: This open-source data mining tool has an intuitive user interface and supports a range of data mining tasks, including classification, regression, and visualization.
- Apache Mahout: This open-source machine-learning library provides users with a set of scalable algorithms for clustering, classification, and collaborative filtering.
- Microsoft SQL Server Analysis Services: This tool is a comprehensive data analysis platform that supports a range of tasks, including regression, clustering, and association rule mining.
These data mining tools are essential for extracting insights from large data sets and can be used in a variety of industries, including finance, healthcare, and marketing.
This is what you should take with you
- Data mining includes all systematic processes to identify relationships or dependencies in data sets.
- It goes beyond pure business intelligence by trying to find explanations for the data changes.
- The different types of data mining include classification, various types of regression or neural networks.

What is the Univariate Analysis?
Master Univariate Analysis: Dive Deep into Data with Visualization, and Python - Learn from In-Depth Examples and Hands-On Code.

What is OpenAPI?
Explore OpenAPI: A Comprehensive Guide to Building and Consuming RESTful APIs. Learn How to Design, Document, and Test APIs.

What is Data Governance?
Ensure the quality, availability, and integrity of your organization's data through effective data governance. Learn more here.

What is Data Quality?
Ensuring Data Quality: Importance, Challenges, and Best Practices. Learn how to maintain high-quality data to drive better business decisions.

What is Data Imputation?
Impute missing values with data imputation techniques. Optimize data quality and learn more about the techniques and importance.

What is Outlier Detection?
Discover hidden anomalies in your data with advanced outlier detection techniques. Improve decision-making and uncover valuable insights.
Other Articles on the Topic of Data Mining
- On the pages of the SAS Institute, you will find an even more detailed description of data mining.

Niklas Lang
I have been working as a machine learning engineer and software developer since 2020 and am passionate about the world of data, algorithms and software development. In addition to my work in the field, I teach at several German universities, including the IU International University of Applied Sciences and the Baden-Württemberg Cooperative State University, in the fields of data science, mathematics and business analytics.
My goal is to present complex topics such as statistics and machine learning in a way that makes them not only understandable, but also exciting and tangible. I combine practical experience from industry with sound theoretical foundations to prepare my students in the best possible way for the challenges of the data world.