The curse of dimensionality is a problem that arises when you have a data set with many attributes/features. At first, it may seem positive to have many attributes and thus a lot of information, but this results in some problems when training Machine Learning models.
What is the Curse of Dimensionality?
The Curse of Dimensionality occurs with high dimensional data sets, those that have a large number of attributes or features. At first, having many attributes is a good thing because they contain a lot of information and circumscribe the data points well. For example, if we have a dataset about people, the attributes can be information such as hair color, height, weight, eye color, etc.
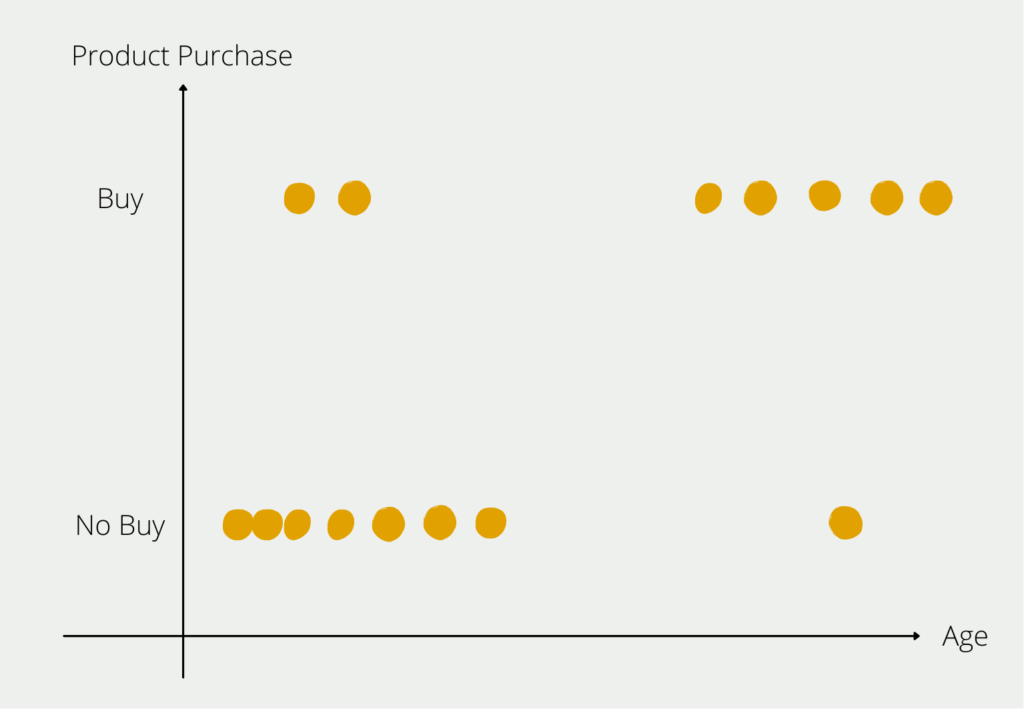
In a mathematical sense, each additional attribute means a new dimension in space and thus a significant increase in possibilities. Suppose we want to find out which customers buy certain products. In the first step, we only consider the age of the prospective customers and whether they have bought the product. We can still map this relatively easily in a two-dimensional diagram.
Once we add more information about the customer, things get a bit more complex. The information about the customer’s income would mean a new axis on which the numerical income is mapped. So the two-dimensional chart becomes a three-dimensional one. The additional attribute “gender” would lead to a fourth dimension and so on.
What problems arise with many dimensions?
When working with data, it is actually desirable to have a lot of attributes and information in the data set to give the model many possibilities to recognize structures in the data. However, it can also lead to serious problems, as the name Curse of Dimensionality already suggests.
Data Sparsity
The example shown illustrates a problem that occurs with many attributes. Due to a large number of dimensions, the so-called data space, i.e. the number of values that a data set can assume, also grows. This can lead to so-called data sparsity. This means that the training data set used to train the model does not contain certain characteristics at all or only very rarely. As a result, the model delivers only poor results for these edge cases.
Let’s assume that we examine 1,000 customers in our example, as it would be too time-consuming to survey even more customers or this data is simply not available. It is possible that all age groups from young to old are relatively well represented among these customers. However, if the additional dimension of income is added, it is rather unlikely that all possibilities of age and income combinations are simultaneously represented among the 1,000 customers.
Distance Concentration
In Machine Learning, when one wants to evaluate the similarity of different datasets, distance functions are often used for this purpose. The most common clustering algorithms, such as k-means clustering, rely on calculating the distance between points and assigning them to a cluster or not depending on the size. In multidimensional spaces, however, it can quickly come to the point that all points are similarly far apart, so that separation seems almost impossible.
We know this phenomenon to some extent from everyday life as well. If you take a photo of two objects, such as two trees, then they can look very close to each other in the picture, since it is only a two-dimensional image. In real life, however, it can happen that the trees are several meters apart, which only becomes clear in three dimensions.
These problems, which can arise in connection with many dimensions, are summarized under the term Curse of Dimensionality.
What can you do about the Curse of Dimensionality?
As you could probably already read out up to this point, the problem lies in the many dimensions. Accordingly, the solution is also obvious: We must manage to reduce the number of dimensions, preferably in such a way that as little information as possible is lost from the original data set.
There are basically two different approaches to this:
Feature Selection
The first solution to combat the Curse of Dimensionality may be very single-minded: we select only those features that contribute particularly well to solving the problem. This means we limit ourselves only to dimensions that have some importance to the problem. There are several ways to do this as well, among the most common are these:
- Correlation analysis: To select suitable attributes, all correlations between two attributes are calculated. If two attributes have a high correlation, it may be possible to remove one of the attributes without losing much information content.
- Multicollinearity: This procedure is similar to the correlation analysis with the difference that not only pairwise attributes are examined, but also whether individual attributes can be represented as a sum, so to speak as a linear regression of other attributes. If this is possible, all attributes that are part of the regression line can be omitted.
The advantage of feature selection is that the attributes are preserved in their original form, which also makes them easier to interpret.
Feature Extraction
The second approach to combat the curse of dimensionality takes a different approach and attempts to form new, summarized dimensions from the many dimensions so that the number of dimensions is reduced while still retaining as much information content as possible.
A frequently used algorithm for this is the so-called Principal Component Analysis. The core idea of Principal Component Analysis is that several variables in a data set may measure the same thing, i.e. they are correlated. Thus, the different dimensions can be combined into fewer so-called principal components without compromising the validity of the data set. Body size, for example, has a high correlation with shoe size, since in many cases tall people also have a larger shoe size and vice versa. So if we remove shoe size as a variable from our data set, the information content does not really decrease.
In statistics, the information content of a data set is determined by the variance. This indicates how far the data points are from the center. The smaller the variance, the closer the data points are to their mean value and vice versa. A small variance thus indicates that the mean value is already a good estimate for the data set.
In the first step, PCA tries to find the variable that maximizes the explained variance of the data set. Then, step by step, more variables are added to explain the remaining part of the variance, because the variance, i.e. the deviation from the mean, contains the most information. This should be preserved if we want to train a model based on it.
This approach can in many cases lead to better results than a feature selection, but it creates new, artificial attributes that are not so easy to interpret. The first main component, for example, is a combination of various attributes. In individual cases, these can then be combined to form a larger supergroup. For example, attributes such as height, weight, and shoe size can be combined and interpreted as the group “physical characteristics”.
In which applications has the Curse of Dimensionality manifested itself?
The Curse of Dimensionality has far-reaching consequences and can affect various areas. Here are some examples and applications:
- Machine Learning: In Machine Learning, high-dimensional data is common, and the Curse of Dimensionality can affect model accuracy and efficiency. Overfitting or underfitting of data can occur, resulting in poor algorithm performance.
- Recommendation Systems: Recommendation Systems suggest products, services, or content to users based on their preferences. In high-dimensional datasets, it becomes difficult to identify meaningful patterns in user behavior, leading to poor recommendations.
- Optimization problems: Optimization problems often involve finding the optimal solution from a large set of possible solutions. In high-dimensional spaces, it becomes increasingly difficult to find the optimal solution, leading to increased computation time and decreased accuracy.
- Computational Biology: Computational biology is concerned with the analysis of large datasets in biology, such as genomic data. In high-dimensional datasets, it becomes difficult to identify meaningful patterns and relationships, leading to inaccurate predictions and analysis.
- Finance: In finance, high-dimensional data is common, such as in portfolio optimization and risk management. The Curse of Dimensionality can impact portfolio performance and risk management strategies, leading to suboptimal results.
Overall, the Curse of Dimensionality can impact a wide range of applications and domains. It highlights the importance of data preprocessing, feature selection, and dimensionality reduction techniques to overcome the limitations of high-dimensional data.
This is what you should take with you
- The Curse of Dimensionality is a phenomenon that occurs when dealing with high-dimensional data, where the amount of data required to accurately represent the data increases exponentially with the number of dimensions.
- This can lead to a number of practical challenges in various applications, such as data storage and processing, and modeling and prediction tasks.
- In particular, the Curse of Dimensionality can lead to overfitting and underfitting problems, where models become either too complex or too simple to accurately capture the underlying patterns in the data.
- Several techniques have been developed to mitigate the effects of the Curse of Dimensionality, such as feature selection, dimensionality reduction, and regularization methods.
- It is important for practitioners to be aware of the Curse of Dimensionality and its effects, and to carefully consider which techniques are appropriate for dealing with high-dimensional data.

Prompt Engineering Explained: Basics, Examples and Best Practices
Why good prompts rarely start with “Write me…” “Write an analysis of this customer feedback.” At first glance, that sounds clear. But an AI model may still return a polished answer that is too broad to be useful. That is where prompt engineering starts: not with magic words, but with removing ambiguity from the task.… Read More »Prompt Engineering Explained: Basics, Examples and Best Practices
Retrieval Augmented Generation: Using Your Own Data with AI
Learn Retrieval Augmented Generation step by step and connect AI with your own data. Start building smarter AI systems today!

Retrieval-Augmented Generation (RAG) Explained: How to Connect LLMs to Your Own Data (Python Tutorial)
Why LLMs Fail at Private Data — And Why RAG Solves It Large language models like GPT-5 or Claude are trained on data up to a certain date. They don’t know what’s inside your company’s internal documentation, your product database, or last quarter’s sales report. They also can’t browse a private Notion workspace or read… Read More »Retrieval-Augmented Generation (RAG) Explained: How to Connect LLMs to Your Own Data (Python Tutorial)

What is a Boltzmann Machine?
Unlocking the Power of Boltzmann Machines: From Theory to Applications in Deep Learning. Explore their role in AI.

What is the Gini Impurity?
Explore Gini impurity: A crucial metric shaping decision trees in machine learning.

What is the Hessian Matrix?
Explore the Hessian matrix: its math, applications in optimization & machine learning, and real-world significance.
Other Articles on the Topic of Curse of Dimensionality
Tony Yiu illustrates the Curse of Dimensionality with a very nice example.

Niklas Lang
I have been working as a machine learning engineer and software developer since 2020 and am passionate about the world of data, algorithms and software development. In addition to my work in the field, I teach at several German universities, including the IU International University of Applied Sciences and the Baden-Württemberg Cooperative State University, in the fields of data science, mathematics and business analytics.
My goal is to present complex topics such as statistics and machine learning in a way that makes them not only understandable, but also exciting and tangible. I combine practical experience from industry with sound theoretical foundations to prepare my students in the best possible way for the challenges of the data world.