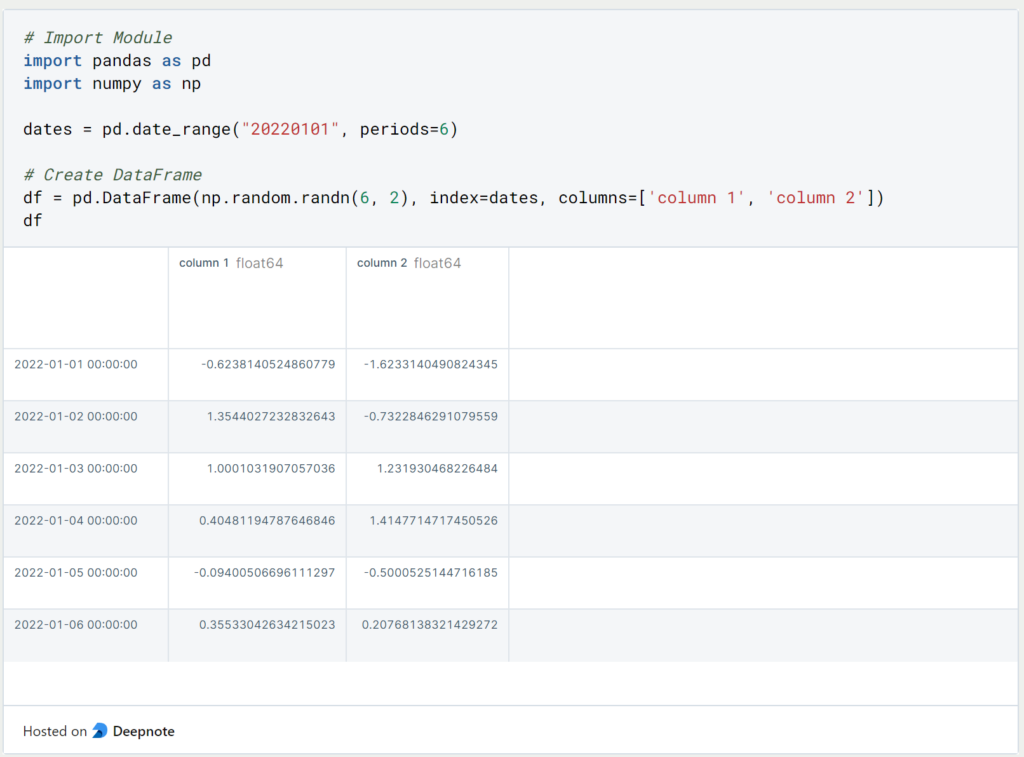
In the first part of this series, we already looked at basic panda objects and how to query them. In this chapter, we will also look at how to handle empty fields and how to merge multiple objects. As a starting example, we will use the same DataFrame as in the first part.
1. How to get the number of rows and columns returned?
When you read in an Excel file, you probably want to get an overview of the pandas DataFrame and get the number of rows and columns. For this you can use the command “.shape”, which returns the number of rows at the first position of the tuple and the number of columns at the second position of the tuple:

2. How do you find out the number of empty fields?
In order to further analyze the DataFrame and possibly use it for training a Machine Learning model, the empty fields are also of particular interest. To get an overview of the number of empty fields, one can use two commands.
The “.count()” function returns the number of non-empty fields column by column. With the number of rows in mind, you can then easily calculate the number of empty fields:

If you want to find out the number of empty fields directly instead, you can also do that using a somewhat nested command. With the help of the first component “.isna()” it is stored in each field with “True” or “False” whether it is an empty field. The function “.sum()” then sums all “False” fields. Thus, the combined function results in the number of empty fields per column.

3. How to delete Empty Fields from a Pandas DataFrame?
Now that we have found out if and how many empty fields are in a column or in the Pandas DataFrame, we can start to clean up the empty fields. One possibility is to delete the corresponding fields or even the whole row.
When we pass empty values to a DataFrame or other Pandas object, they are automatically replaced by Numpy NaNs (Not a Number). For calculations, such as averaging, these fields are not included and are ignored. We can simply extend the existing DataFrame with an empty third column containing a value only for the index 01/01/2022. The remaining values are then automatically set as NaN.
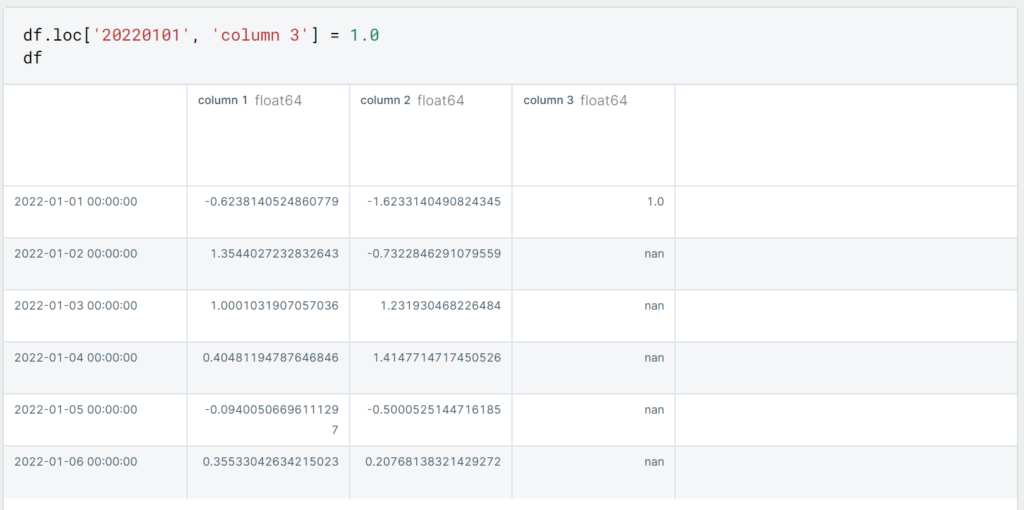
If we want to delete all rows that have an empty value in at least one of the columns, we can do that using the following command.

If we want to delete columns with missing values instead, we use the same command and additionally set ‘axis = 1’.
4. How can empty fields in a DataFrame be replaced?
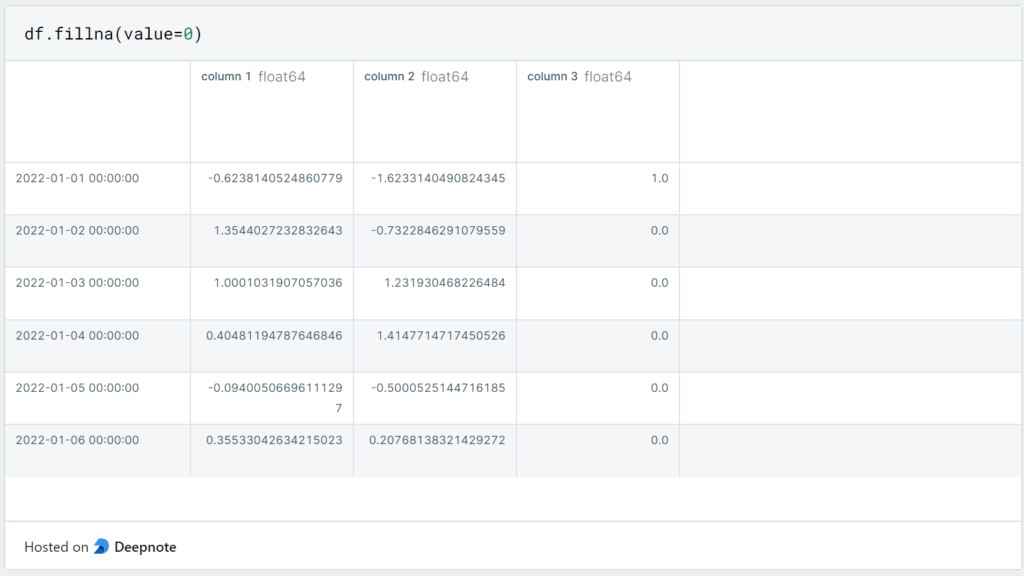
If we don’t want to delete the rows or columns with the empty fields, we can also replace the non-filled fields with a default value. For this purpose we use the “.fillna()” command with the “value” parameter. This parameter defines which value should be inserted instead:
In some cases, it can also be useful to display the missing values as Boolean values (True/False). In most cases, however, the DataFrame objects are too large and this is not a useful representation.

5. How can I delete specific Rows from a DataFrame?
If we don’t want to just delete empty values from our DataFrame, there are two ways we can do that. First, we can delete the rows from the DataFrame by using the index of the row we want to delete. In our case, this is a concrete date, such as 01.01.2022:
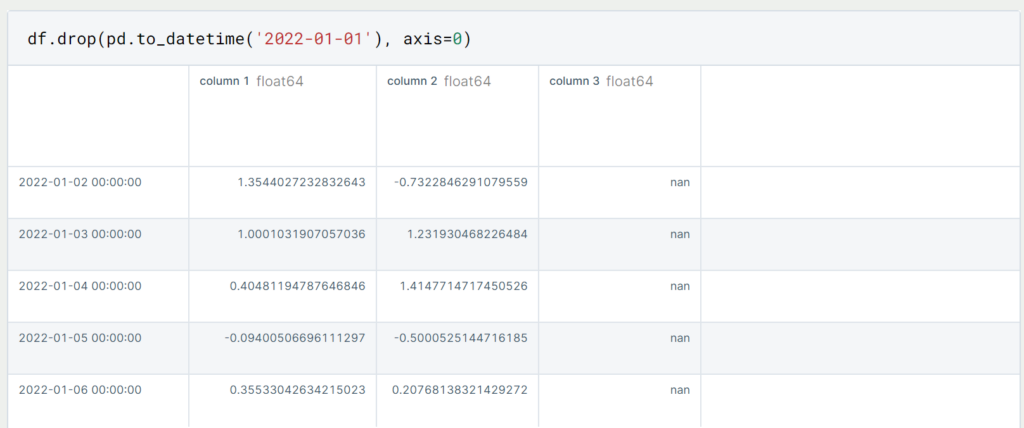
By doing this, we have deleted the first line in this object. In most cases, however, we will not yet know the specific row that we want to delete. Then we can also filter the DataFrame to the rows we want to delete and then output the indexes of the corresponding rows.
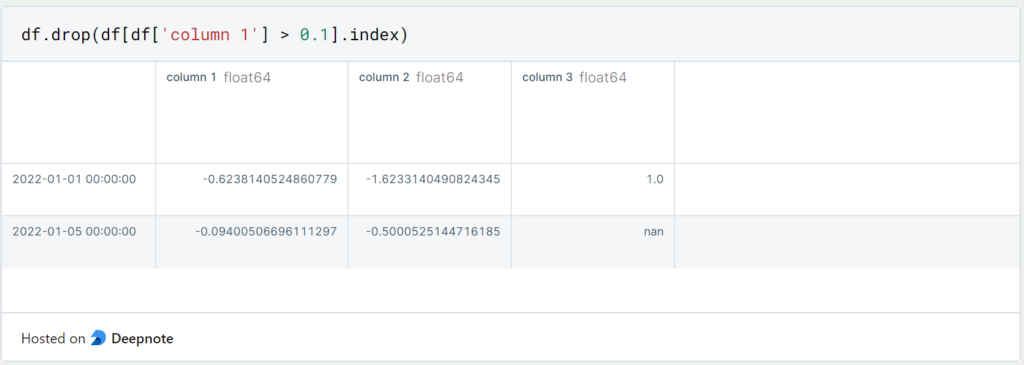
In this case, we delete all lines for which a value greater than 0.1 is detected in “column 1”. This leaves a total of four lines in the “df” object.
6. How to add a Column?
Again, there are several ways to add new columns to the existing DataFrame. By simply defining the new column with square brackets it will be added as a new column to the DataFrame from the right.
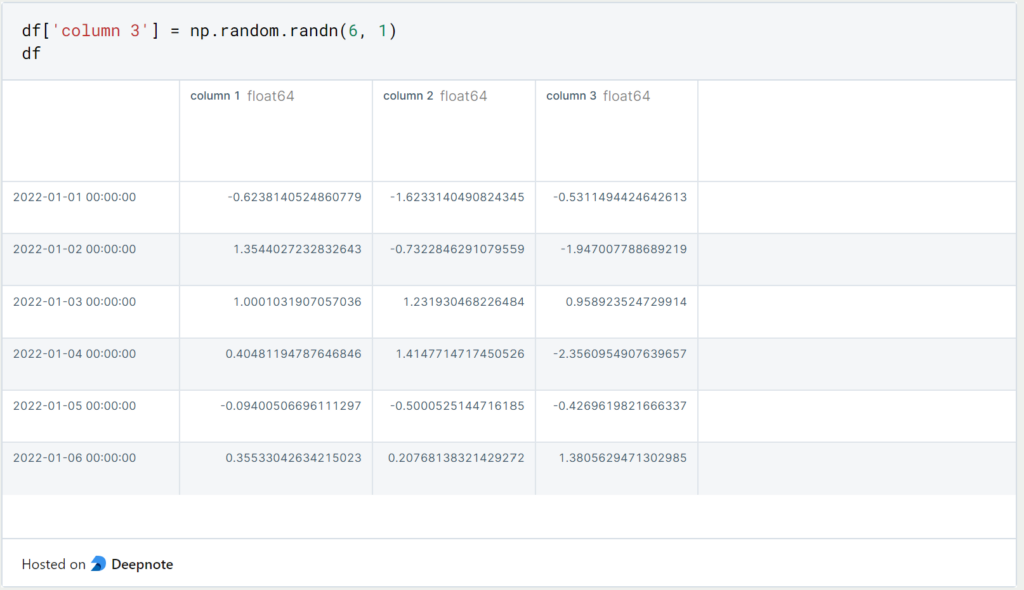
If instead, we want to insert the new column at a specific index, we can use “df.insert()” for that:
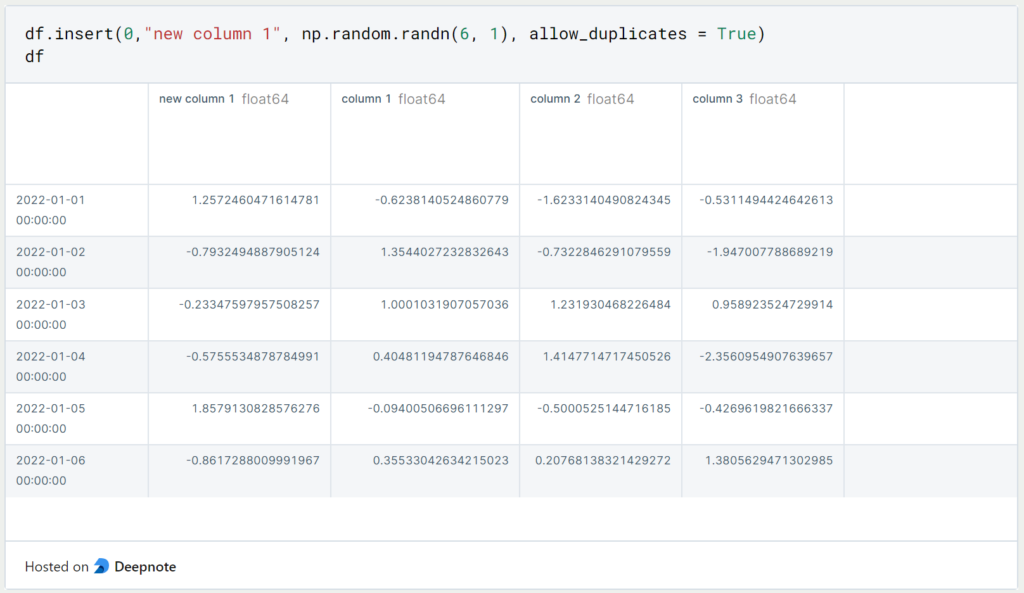
The first value passed to this function is the index of the new column to be inserted, then the name of the column, and thirdly the object to be inserted as the column. The last parameter specifies whether duplicates of this column are allowed. So if the column with the name and the same values already exists and “allow_duplicates” is set to “False”, then you will get an error message.
7. How to delete a Column?
As with any good pandas command, there are several options for dropping columns. The two easiest are either using the function “df.drop()” and the name of the column, and “axis=1” for a column selection. Or you can use the standard Python function “del” and define the corresponding column:

8. How to merge Pandas DataFrames?
Pandas provide several ways to concatenate Series or DataFrame objects. The concat command extends the first-named object by the second-named object if they are of the same type. The command can of course be executed with more than two data structures.

With DataFrames the code line looks the same. The addition ‘ignore_index’ is used to assign a new continuous index and not the index from the original object.
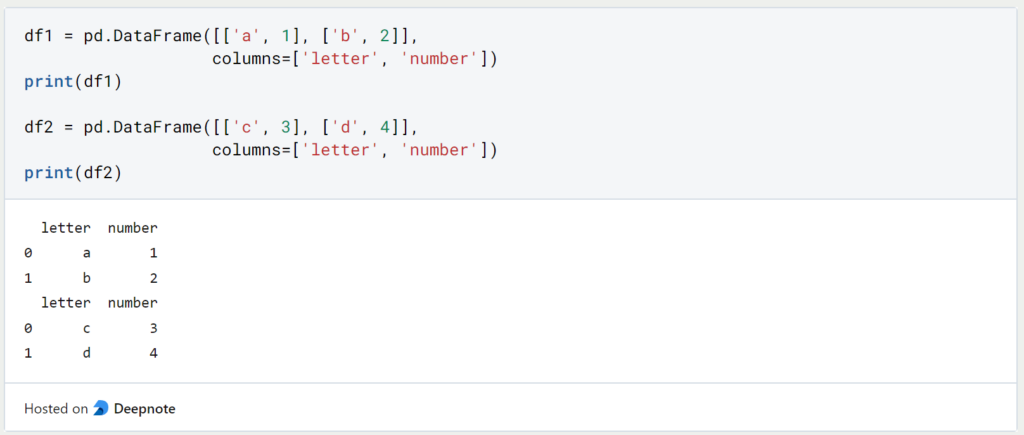
Pandas also allow joining possibilities with ‘Merge’, which most people are probably familiar with from SQL.
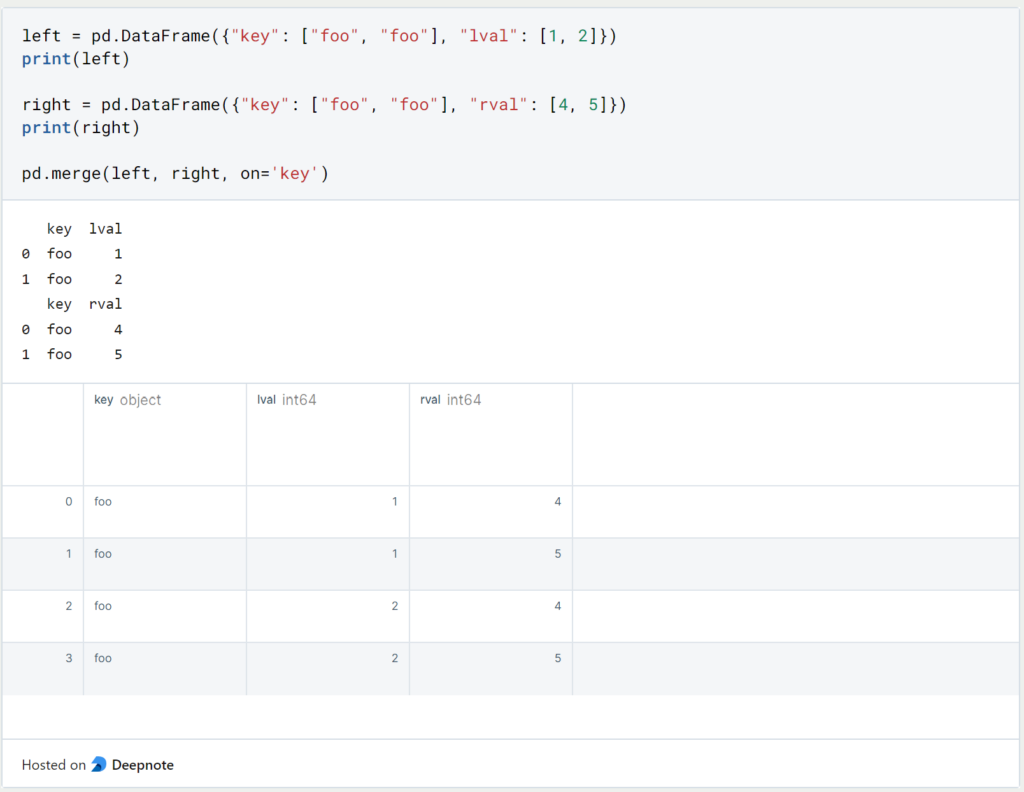
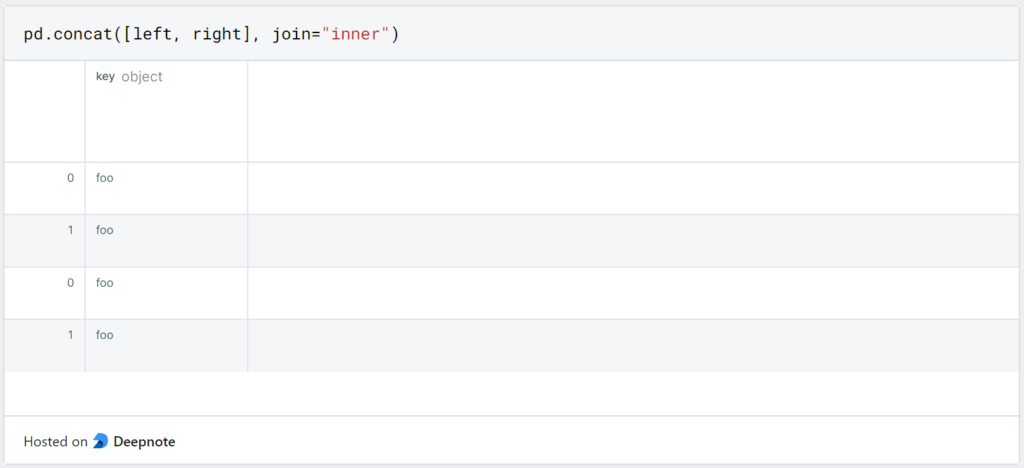
If we want to perform an inner join instead of left or right joins, we again use the Concat command with the addition ‘join = “inner”‘.
Why should you use a Pandas DataFrame?
Using Pandas Dataframes has several advantages:
- Easy data manipulation: Pandas dataframes provide an easy way to manipulate data. You can easily perform operations such as merging, grouping, and filtering data using Pandas dataframes.
- Data cleansing: Data cleansing is an important step in data analysis. Pandas Dataframes facilitate data cleansing by providing functions to handle missing values, duplicate records, and inconsistent data.
- Data Visualization: Panda’s dataframes can be easily visualized using libraries such as Matplotlib and Seaborn. You can quickly create plots, charts, and graphs to analyze data and communicate insights.
- Interoperability: Panda’s dataframes easily integrate with other data analysis tools and libraries, including NumPy, Scikit-Learn, and TensorFlow.
- Efficient memory management: Panda’s Dataframes are designed to efficiently manage memory usage, even for large datasets. The library allows data to be loaded and processed in chunks to reduce memory requirements.
- Speed: Pandas is designed to work efficiently with numerical operations on large data sets. It builds on NumPy, which is optimized for numerical operations and vectorization, making Pandas Dataframes a fast and efficient tool for data analysis.
Overall, Pandas Dataframes is a powerful tool for data analysis and manipulation, offering a wide range of features and capabilities that make working with and analyzing data easier.
What are best practices when working with Pandas DataFrames?
Here are some best practices and tips for working with a Pandas DataFrame:
- Read the documentation: Before working with a Pandas DataFrame, it is important to understand the documentation and the structure of the DataFrame.
- Data cleansing and preparation: Data cleansing is one of the most important aspects of working with a Pandas DataFrame. You should always clean and prepare the data before performing any analysis. This includes removing duplicates, dealing with missing values, and converting data types.
- Indexing: Indexing is an important aspect of working with a Pandas DataFrame. You can select rows and columns using the loc and iloc functions. The loc function is used for label-based indexing, while the iloc function is used for positional indexing.
- Avoid iterating over rows: Iterating over rows in a Pandas DataFrame can be slow and inefficient. Instead, you should try to vectorize your operations and use built-in functions that are optimized for performance.
- Use groupby: The groupby function in Pandas is a powerful tool for data analysis. It allows you to group data by one or more columns and apply aggregate functions to the groups.
- Use merge and join: The merge and join functions in Pandas are used to combine data frames. With these functions you can combine data frames based on a common column or index.
- Use the apply function: The apply function in Pandas allows you to apply a function to any row or column of a data frame. This can be useful for performing custom calculations or transformations on your data.
- Use the built-in functions: Pandas has a wide range of built-in functions that are optimized for performance. You should always try to use these functions instead of writing your own custom functions.
- Keep your data types consistent: It is important that you keep your data types consistent in a Pandas DataFrame. This will ensure that your data is formatted correctly and that there are no errors.
- Use the right data structures: Pandas offers several data structures, including Series, DataFrame and Panel. You should choose the right data structure based on your data and the analysis you are performing.
This is what you should take with you
- Pandas offers many possibilities to deal with missing values. You can either delete the columns/rows in question or replace the fields with a value.
- With Pandas, we have the same join possibilities as with SQL.
Thanks to Deepnote for sponsoring this article! Deepnote offers me the possibility to embed Python code easily and quickly on this website and also to host the related notebooks in the cloud.
What is Jenkins?
Mastering Jenkins: Streamline DevOps with Powerful Automation. Learn CI/CD Concepts & Boost Software Delivery.
What are Conditional Statements in Python?
Learn how to use conditional statements in Python. Understand if-else, nested if, and elif statements for efficient programming.
What is XOR?
Explore XOR: The Exclusive OR operator's role in logic, encryption, math, AI, and technology.
How can you do Python Exception Handling?
Unlocking the Art of Python Exception Handling: Best Practices, Tips, and Key Differences Between Python 2 and Python 3.
What are Python Modules?
Explore Python modules: understand their role, enhance functionality, and streamline coding in diverse applications.
What are Python Comparison Operators?
Master Python comparison operators for precise logic and decision-making in programming.
Other Articles on the Topic of Pandas
- The official documentation of Pandas can be found here.
- This post is mainly based on the tutorial from Pandas. You can find it here.

Niklas Lang
I have been working as a machine learning engineer and software developer since 2020 and am passionate about the world of data, algorithms and software development. In addition to my work in the field, I teach at several German universities, including the IU International University of Applied Sciences and the Baden-Württemberg Cooperative State University, in the fields of data science, mathematics and business analytics.
My goal is to present complex topics such as statistics and machine learning in a way that makes them not only understandable, but also exciting and tangible. I combine practical experience from industry with sound theoretical foundations to prepare my students in the best possible way for the challenges of the data world.


