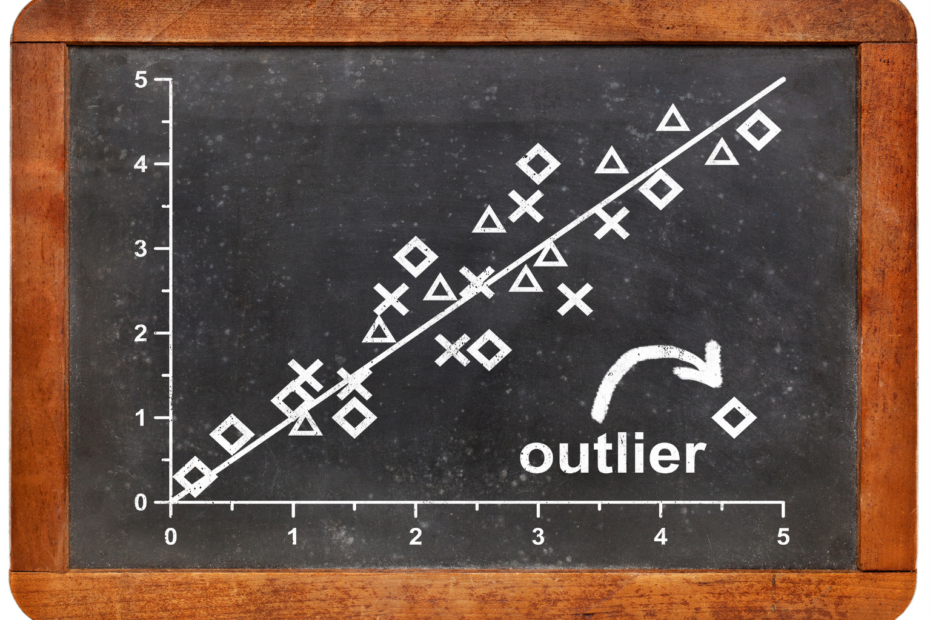
What is Outlier Detection?
Discover hidden anomalies in your data with advanced outlier detection techniques. Improve decision-making and uncover valuable insights.
Discover hidden anomalies in your data with advanced outlier detection techniques. Improve decision-making and uncover valuable insights.
Learn how to create interactive visualizations and dashboards with Plotly, a Python data visualization library.

Visualize your data like a pro with Matplotlib: A comprehensive guide to the Python plotting library.
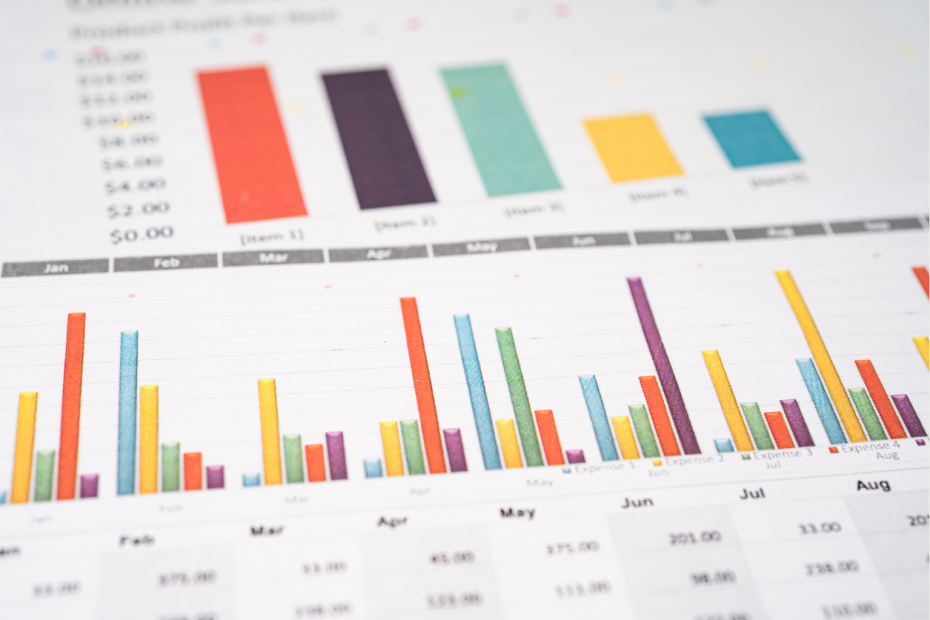
Discover the power of bar charts in data visualization. Learn how to create, customize, and interpret bar charts for insightful data analysis.

Build interactive data apps effortlessly with Streamlit: Simplify development, visualize data, handle user input, and deploy with ease.

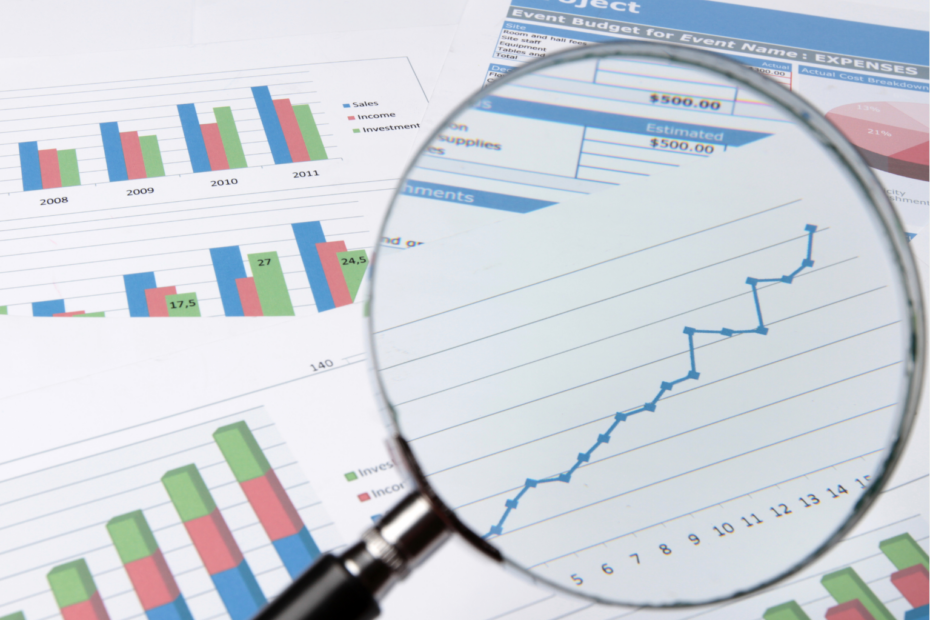
Master the art of line charts: Learn how to visualize trends and patterns in your data with our comprehensive guide.

Unlock the power of data visualization with Power BI. Create interactive dashboards and gain valuable insights for informed business decisions.

Learn how to use Tableau for data visualization and analysis in our comprehensive guide.

Discover the modern data stack: A comprehensive guide to building scalable and efficient data pipelines. Learn more now!

Unlock insights and drive growth with Business Intelligence. Learn the benefits and best practices for effective data analysis.