Anomaly detection is a technique used in data analysis to identify data points or patterns that do not conform to expected behavior or do not fit well with the rest of the dataset. Anomalies can be indicative of errors in data collection, data processing, or underlying systems, or they may represent unusual events, fraud, or cyber-attacks.
The ability to detect anomalies in large datasets is critical for businesses, organizations, and governments to maintain the quality, safety, and reliability of their systems and services. In recent years, the increasing availability of big data and Machine Learning algorithms has made it possible to automate the process of anomaly detection, improving efficiency and accuracy in various domains such as cybersecurity, finance, health, and manufacturing.
What are the types of anomalies?
Anomaly detection is the process of identifying patterns in data that deviate significantly from the expected behavior. The term “anomaly” refers to any observation that is significantly different from other observations in a dataset. Anomalies can occur for various reasons, including measurement errors, data corruption, or genuine unusual events. In general, anomalies can be categorized into three types:
- Point Anomalies: Point anomalies refer to individual data points that are considered anomalous with respect to the rest of the data. For example, in a dataset of temperature readings, a point anomaly could be a reading that is significantly higher or lower than the others.
- Contextual Anomalies: Contextual anomalies refer to data points that are anomalous within a specific context. For example, in a dataset of credit card transactions, a transaction that is large in amount may not be considered an anomaly in the context of a high-rolling customer, but it may be considered an anomaly for a customer with a low credit limit.
- Collective Anomalies: Collective anomalies refer to a group of data points that are anomalous when considered together but may not be anomalous individually. For example, in a dataset of network traffic, a sudden increase in traffic volume from a particular region may be considered a collective anomaly.
These types of anomalies are useful for understanding the behavior of data and designing algorithms for anomaly detection. Anomaly detection algorithms typically identify anomalies based on the type of data and the context in which it is being used.
What are the techniques of Anomaly Detection?
Anomaly detection is a crucial task in data analysis that aims to identify unusual patterns or outliers in data. There are various techniques for anomaly detection, including:
- Statistical Techniques: These techniques rely on statistical models and probability theory to identify anomalies. For instance, the Z-score method and the Grubbs’ test are widely used statistical techniques for detecting outliers in data.
- Machine Learning Techniques: Machine learning techniques, including supervised and unsupervised learning methods, are used for anomaly detection. In supervised learning, anomaly detection involves training a model on normal and anomalous data and then using the model to predict anomalies. In contrast, unsupervised learning methods identify anomalies in data without prior knowledge of normal and anomalous data. Common machine learning techniques used for anomaly detection include clustering, decision trees, support vector machines (SVM), and neural networks.

- Time Series Techniques: Time series techniques are used to identify anomalies in time-series data, such as stock prices and weather data. These techniques use historical data to identify patterns and detect anomalies in future data points. Common time series techniques for anomaly detection include autoregression integrated moving average (ARIMA), Seasonal decomposition of time series (STL), and Exponential Smoothing.
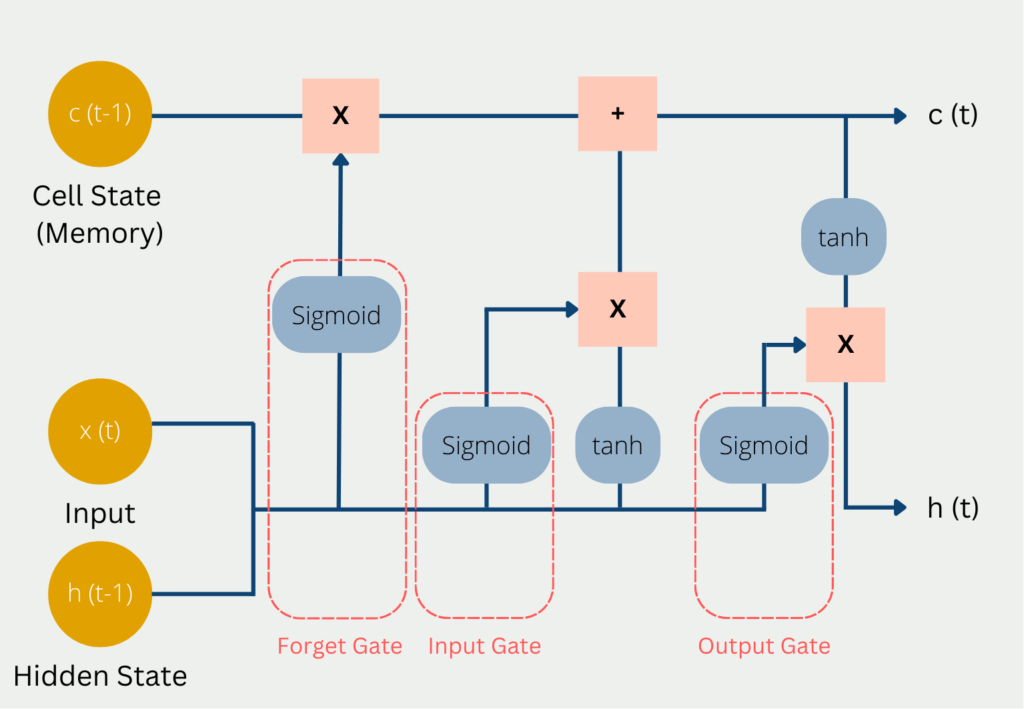
- Deep Learning Techniques: Deep learning techniques, including convolutional neural networks (CNN), recurrent neural networks (RNN), and long short-term memory (LSTM), are used for anomaly detection in image, audio, and text data. Deep learning methods can identify complex patterns and detect anomalies in data that may be missed by other techniques.
- Rule-based Techniques: Rule-based techniques involve defining rules or thresholds for detecting anomalies in data. For instance, if a data point is outside a predefined range or threshold, it is flagged as an anomaly. Rule-based techniques are simple to implement and can be effective for identifying anomalies in specific domains such as cybersecurity and fraud detection.
Each technique has its strengths and weaknesses and may be more appropriate for a particular type of data. Therefore, the choice of the appropriate technique for anomaly detection depends on the nature of the data and the specific requirements of the application.
Why is Data Preprocessing important in Anomaly Detection?
Data preprocessing is a crucial step in anomaly detection that significantly impacts the accuracy and effectiveness of the algorithms. It involves several considerations to prepare the data for analysis.
One important aspect is data cleaning, which addresses missing values, outliers, and inconsistent data points. Missing values can be imputed using techniques like mean or median imputation. Outliers, which can distort the analysis, can be identified and treated by removing or replacing them appropriately.
Another consideration is feature scaling, which ensures that the features are on a similar scale. This step is important because anomaly detection algorithms often rely on distance or similarity measures. Techniques like min-max scaling, standardization, or robust scaling can be applied to achieve this.
Dimensionality reduction is also important to reduce computational complexity and overcome the curse of dimensionality. Techniques like principal component analysis (PCA) or linear discriminant analysis (LDA) can be used to extract relevant information while reducing the number of features.
Handling imbalanced datasets is a challenge in anomaly detection, where normal instances may significantly outnumber anomalous instances. Techniques like oversampling, undersampling, or specialized algorithms for imbalanced data can be used to balance the dataset and prevent biased results.
Feature selection and engineering play a role in identifying the most relevant features and creating new features. Techniques like correlation analysis or feature importance estimation can help select informative features. Domain knowledge-driven feature engineering allows the creation of new features based on a deep understanding of the problem domain.
By carefully considering these preprocessing steps, analysts can improve the accuracy and reliability of anomaly detection models. Effective data preprocessing contributes to detecting meaningful anomalies and making informed decisions based on the results.
How to evaluate Anomaly Detection?
Anomaly detection is an important task in many fields, including finance, healthcare, cybersecurity, and industrial automation. There are several evaluation metrics that are commonly used to assess the performance of anomaly detection techniques, including:
- Accuracy: This is the most commonly used metric for evaluating anomaly detection techniques. It measures the percentage of correctly classified anomalies in the data.
- Precision: Precision measures the percentage of correctly classified anomalies out of all the anomalies that were detected. This metric is important when the cost of false positives is high.
- Recall: Recall measures the percentage of correctly classified anomalies out of all the actual anomalies in the data. This metric is important when the cost of false negatives is high.
- F1 score: The F1 score is a weighted harmonic mean of precision and recall. It is a good metric to use when both false positives and false negatives are important.
- Area Under the Receiver Operating Characteristic (ROC) Curve: The ROC curve is a graphical representation of the performance of an anomaly detection technique. The area under the curve is used as a metric to evaluate the performance of the technique.
- False Positive Rate (FPR): The FPR measures the percentage of non-anomalous data points that were classified as anomalies. It is an important metric when the cost of false positives is high.
- False Negative Rate (FNR): The FNR measures the percentage of actual anomalies that were not detected by the technique. It is an important metric when the cost of false negatives is high.
- Mean Time to Detection (MTTD): MTTD measures the time it takes for an anomaly to be detected by the technique. This metric is important when the timely detection of anomalies is critical.
It is important to carefully choose the evaluation metric(s) based on the specific use case and requirements of the application. In addition, it is important to evaluate the performance of the technique on both training and test data to ensure that it generalizes well to new, unseen data.
How to handle imbalanced data in Anomaly Detection?
Imbalanced data poses a significant challenge for anomaly detection algorithms. The class imbalance, where normal instances vastly outnumber anomalous instances, can lead to biased models that struggle to identify rare anomalies accurately. The algorithms tend to prioritize the majority class, resulting in a higher tendency to classify instances as normal, leading to a higher false negative rate. This means that the algorithm may miss crucial anomalous patterns, impacting the effectiveness of anomaly detection. Handling imbalanced data is crucial to ensure that the algorithms can detect and highlight rare anomalies effectively, providing more reliable results for decision-making and risk management.
There are various techniques and approaches that can be used to overcome this imbalance:
- Resampling Techniques: They aim to rebalance the dataset by either oversampling the minority class (anomalous instances) or undersampling the majority class (normal instances). Oversampling techniques generate synthetic samples of the minority class, such as through duplication or by using algorithms like Synthetic Minority Over-sampling Technique (SMOTE). Undersampling techniques randomly remove instances from the majority class to achieve a balanced distribution. The goal is to create a more equitable representation of both classes, enabling the anomaly detection algorithm to learn from a balanced dataset.
- Algorithmic Approaches: Specialized algorithms are designed to handle imbalanced data and can be applied directly in anomaly detection. These algorithms typically employ techniques such as cost-sensitive learning, where misclassification costs are adjusted to account for class imbalance. They assign higher misclassification penalties to the minority class, encouraging the algorithm to pay more attention to detecting anomalies.
- Ensemble Methods: They combine multiple anomaly detection models to improve performance on imbalanced data. By training several models on different subsets of the imbalanced dataset and aggregating their predictions, ensemble methods can provide a more robust and balanced decision-making process. Techniques such as bagging, boosting, or stacking can be employed to create diverse models that collectively capture both normal and anomalous patterns effectively.
- Anomaly Score Thresholding: Adjusting the threshold for anomaly scores can be an effective strategy for handling imbalanced data. Anomaly scores represent the degree of abnormality assigned to each instance by the detection algorithm. By setting a lower threshold for anomalies, the algorithm becomes more sensitive to detecting the minority class. However, this approach should be carefully tuned to avoid an excessive number of false positives.
- Cost-Benefit Analysis: Performing a cost-benefit analysis helps in understanding the implications of different misclassification scenarios. Assigning different costs or benefits to false positives and false negatives can guide the selection of appropriate anomaly detection techniques. For example, in certain domains, false negatives (missed anomalies) may have severe consequences, while false positives (false alarms) may incur less impact. By considering the specific costs and benefits, one can prioritize the detection of anomalies over false positives or vice versa.
Handling imbalanced data in anomaly detection requires careful consideration and tailored approaches. The choice of technique depends on the characteristics of the dataset, the domain, and the desired trade-off between detection performance and false alarms. By applying suitable resampling techniques, algorithmic approaches, ensemble methods, and considering the appropriate anomaly score threshold and cost-benefit analysis, analysts can effectively address the challenges posed by imbalanced data, leading to improved anomaly detection results.
What are the applications of Anomaly Detection?
Anomaly detection is a critical task in various fields such as finance, healthcare, security, and manufacturing. Here are some of the most common applications:
- Fraud Detection: Anomaly detection can be used to detect fraudulent activities in financial transactions, such as credit card fraud and money laundering.
- Cybersecurity: It can be used to detect malicious activities and network intrusions in computer networks.
- Healthcare: Anomaly detection can be used to detect anomalies in medical images, such as CT scans, MRI, and X-rays, to help with the early detection of diseases.
- Manufacturing: It can be used to detect anomalies in production lines and predict equipment failures to prevent downtime and improve efficiency.
- Internet of Things (IoT): Anomaly detection can be used to monitor and detect anomalies in data streams from IoT devices, such as temperature sensors and vibration sensors.
- Energy: Anomaly detection can be used to detect anomalies in energy consumption patterns and predict future energy demands.
- Transportation: Anomaly detection can be used to monitor and detect anomalies in traffic flow and predict traffic congestion.
- Social Media: This technique can be used to detect abnormal activities, such as fake news and spam, in social media networks.
Overall, anomaly detection plays a vital role in identifying abnormal behavior and preventing potential threats, making it an essential tool in many domains.
This is what you should take with you
- Anomaly detection is a crucial task in many fields, such as cybersecurity, finance, healthcare, and manufacturing.
- There are several types of anomalies, including point anomalies, contextual anomalies, and collective anomalies.
- Anomaly detection techniques can be categorized into supervised, unsupervised, and semi-supervised methods.
- Common algorithms used for anomaly detection include statistical models, clustering, neural networks, and decision trees.
- The evaluation of anomaly detection techniques can be done through metrics such as precision, recall, F1 score, and ROC curve.
- Applications of anomaly detection include fraud detection, fault detection, intrusion detection, predictive maintenance, and anomaly-based intrusion prevention.
- The effectiveness of anomaly detection depends on the quality of the data, the choice of algorithm, and the tuning of parameters.
- Anomaly detection is a rapidly evolving field, with new algorithms and techniques being developed to handle increasingly complex and large-scale data.

What is Collaborative Filtering?
Unlock personalized recommendations with collaborative filtering. Discover how this powerful technique enhances user experiences. Learn more!

What is Quantum Computing?
Dive into the quantum revolution with our article of quantum computing. Uncover the future of computation and its transformative potential.

What is the T5-Model?
Unlocking Text Generation: Discover the Power of T5 Model for Advanced NLP Tasks - Learn Implementation and Benefits.


What is MLOps?
Discover the world of MLOps and learn how it revolutionizes machine learning deployments. Explore key concepts and best practices.

What is Jupyter Notebook?
Learn how to boost your productivity with Jupyter notebook! Discover tips, tricks, and best practices for data science and coding. Get started now.
Other Articles on the Topic of Anomaly Detection
You can find a detailed article on how to do Anomaly Detection in Scikit-Learn here.

Niklas Lang
I have been working as a machine learning engineer and software developer since 2020 and am passionate about the world of data, algorithms and software development. In addition to my work in the field, I teach at several German universities, including the IU International University of Applied Sciences and the Baden-Württemberg Cooperative State University, in the fields of data science, mathematics and business analytics.
My goal is to present complex topics such as statistics and machine learning in a way that makes them not only understandable, but also exciting and tangible. I combine practical experience from industry with sound theoretical foundations to prepare my students in the best possible way for the challenges of the data world.