Multivariate analysis comprises various methods within statistics that deal with data analysis in which several variables are considered simultaneously. In application areas such as medicine, economics, or the life sciences, more and more complex data sets are being collected, which is why multivariate analysis has become indispensable in these areas. It includes powerful tools for gaining insights into complex relationships.
In this article, we examine the basics of multivariate analysis and the different methods used in detail. These include the most important methods, such as principal component analysis, cluster methods, and regression methods. We then examine the interpretation of the results more closely so that specific questions can be adequately answered. Finally, we also show the advantages and disadvantages of multivariate analysis.
What is Multivariate Analysis?
Multivariate analysis comprises statistical methods for simultaneously analyzing several variables and their correlations. This makes it possible to recognize interactions between variables that would have remained undetected in an isolated analysis. These findings are then used to train precise prediction models. By looking at several variables simultaneously, correlations can be discovered between individual characteristics and complete groups of characteristics. This understanding helps in the selection of decision models and the formulation of hypotheses.
In addition, multivariate analysis often makes it possible to reduce data complexity so that the information in the data set is compressed into fewer dimensions. This property is beneficial for visualizing the data and also makes it easier to interpret.
The possible applications of multivariate analysis are very diverse and include, for example, the following areas:
- Medicine: Human health is made up of many interactions and is influenced, for example, by blood pressure, cholesterol levels, or genetic factors. Multivariate analysis can help bring all these characteristics into a model, and in this way, risk factors for diseases can be identified or diagnoses made.
- Biology: In the field of genetic research, multivariate analyses are used to identify gene functions and investigate expression patterns. By being able to analyze thousands of genes simultaneously, researchers can gain insights into the influences of genes on diseases.
- Finance: When creating investment portfolios, the included risk plays a major role to be able to weigh up whether the profit is in good proportion to the risk taken. By determining the correlation between asset classes and various economic indicators, the risk can be adequately assessed and investment decisions can be made on this basis.
Multivariate analysis offers powerful tools for a wide range of applications and the interpretation of the underlying correlations.
What steps should take place in Data Pre-Processing?
For multivariate analysis to make the best possible predictions, the data must be prepared carefully. Data quality influences the model’s ability to recognize patterns and correlations that should not be underestimated. In this section, we look at the three most important factors that should be taken into account when pre-processing data.
Data Quality
In the area of data quality, special attention should be paid to these points to be able to conduct a successful multivariate analysis:
- Completeness: All data points in the data set should have values for all variables so that there are no missing values. Missing data can lead to certain patterns not being recognized or their influence being underestimated. If there are empty fields, these data points should be removed from the data set if possible. However, if the size of the data set does not allow this, methods can also be used to insert values accordingly. For example, the mean value of the variables can be entered in the missing fields.
- Consistency: Consistency in the data set should be ensured so that similar entries in the data set are collected uniformly across. This point prevents contradictions from arising in the data set that could distort the multivariate analysis. This point includes, for example, that all weight information in the data was measured using a scale and that some of the body weights were not simply estimated by the respondents.
- Outlier Treatment: Outliers are values in a data set that are outside the normal range that would otherwise occur. Depending on the analysis objective, it can be decided whether the outliers should be removed from the data set or transformed. However, it is important to examine the data set for outliers and make an appropriate decision.
Normalization & Standardization
Many multivariate analysis methods assume or provide better results if all variables are on a similar scale to make the results comparable. In data sets, however, it can quickly happen that the variables are available in different value ranges and units. If, for example, body weight is measured in a data series, this is at most in the three-digit range. However, if the annual income of a respondent is queried at the same time, this can be in the six- or even seven-digit range, meaning that the value ranges between weight and annual income differ greatly. There are various methods to bring these values into a uniform framework.
- Standardization: During standardization, the values are transformed in such a way that they follow a uniform data distribution, i.e. they have a mean value of 0 and a standard deviation of 1, for example. This results in the scale of all variables becoming comparable, but without the data changing its original distribution. Certain methods of multivariate analysis, such as principal component analysis, contain falsified results if the data are not standardized.
- Normalization: Normalization, on the other hand, merely brings the data to a common range of values, for example between 0 and 1, but changes the distribution of the data. A common form of normalization is to divide all values by the maximum value of the variable so that the data (if there are no negative values) then lies in the range between 0 and 1.
Data Cleansing
Data cleansing comprises various steps that serve to create a data set that is as complete and error-free as possible. The methods used depend heavily on the variables and values and can include the following points, for example.
- Correcting Biases: Biases are systematic errors in data collection, which can occur, for example, if certain groups are overrepresented in the data set compared to the population as a whole. There are various methods for correcting these, such as resampling or the use of weightings for certain data points. This creates a representative database for the multivariate analysis.
- Standardization: In this step, the variables are brought to a common unit if the values are collected in different units. This makes it much easier to compare the values with each other.
- Dealing with Missing Values: If it has been recognized in the area of data quality that incomplete data exists, then this should be rectified during data cleansing. Common methods for this include deleting the entire data point or estimating the missing values based on the other existing values of the variables.
What are the most important Methods in Multivariate Analysis?
Multivariate analysis covers a wide range of methods and algorithms for learning complex relationships and structures from data. A distinction is made between two main areas:
- Structure-Discovering Methods: The algorithms in this group are concerned with finding new relationships and patterns in the data set without these being specified by the user. They can therefore be used above all when there are no hypotheses as to what dependencies might exist between variables or objects. Depending on the respective source, structure-discovering methods are also referred to as explorative methods.
- Structure-Checking Methods: Structure-checking methods, on the other hand, deal with the analysis and verification of concretely specified relationships in a data set. They can help to test specific hypotheses of the user and provide reliable results. Various sources also refer to inductive methods.
In the following sections, we explain the most important methods in these two sub-areas.
Structure-Discovering Methods
Structure-discovering methods are particularly useful when no hypothesis about the data is yet known and therefore no specifications can be made about possible correlations. The following methods can recognize structures and patterns independently without the user having to provide any input.
Principal Component Analysis
Many machine learning models have problems with many input variables, as these can lead to the so-called curse of dimensionality. This describes a variety of problems that occur when more features are added to a data set. There are also models, such as linear regression, that are sensitive to correlated input variables. It can therefore make sense to reduce the number of features in data pre-processing. However, it must be ensured that as little information as possible is lost in this step.
The principal component analysis assumes that several variables in a data set may measure the same thing, i.e. that they are correlated. These different dimensions can be mathematically combined into so-called principal components without compromising the informative value of the data set. Shoe size and height, for example, are often correlated and can therefore be replaced by a common dimension to reduce the number of input variables.
Principal component analysis (PCA) describes a method for mathematically calculating these components. The following two key concepts are central to this:
The covariance matrix is a matrix that specifies the pairwise covariances between two different dimensions of the data space. It is a square matrix, i.e. it has as many rows as columns. For any two dimensions, the covariance is calculated as follows:
\(\)\[Cov\left(X,\ Y\right)= \frac{\sum_{i=1}^{n}{\left(X_i-\bar{X}\right)\cdot(Y_i-\bar{Y})}}{n-1}\]
Here \(n\) stands for the number of data points in the data set, \(X_i\) is the value of the dimension \(X\) of the \(i\)th data point and \(\bar{X}\) is the mean value of the dimension \(X\) for all \(n\) data points. As can be seen from the formula, the covariances between two dimensions do not depend on the order of the dimensions, so the following applies \(COV(X,Y) = COV(Y,X)\). These values result in the following covariance matrix \(C\) for the two dimensions \(X\) and \(Y\):
\(\)\[C=\left[\begin{matrix}Cov(X,X)&Cov(X,Y)\\Cov(Y,X)&Cov(Y,Y)\\\end{matrix}\right]\]
The covariance of two identical dimensions is simply the variance of the dimension itself, i.e:
\(\)\[C=\left[\begin{matrix}Var(X)&Cov(X,Y)\\Cov(Y,X)&Var(Y)\\\end{matrix}\right]\]
The covariance matrix is the first important step in the principal component analysis. Once this matrix has been created, the eigenvalues and eigenvectors can be calculated from it. Mathematically, the following equation is solved for the eigenvalues:
\(\)\[\det{\left(C-\ \lambda I\right)}=0\]
Here \(\lambda\) is the desired eigenvalue and \(I\) is the unit matrix of the same size as the covariance matrix (C). When this equation is solved, one or more eigenvalues of a matrix are obtained. They represent the linear transformation of the matrix in the direction of the associated eigenvector. An associated eigenvector can therefore also be calculated for each eigenvalue, for which the slightly modified equation must be solved:
\(\)\[\left(A-\ \lambda I\right)\cdot v=0\]
Where \(v\) is the desired eigenvector, according to which the equation must be solved accordingly. In the case of the covariance matrix, the eigenvalue corresponds to the variance of the eigenvector, which in turn represents a principal component. Each eigenvector is therefore a mixture of different dimensions of the data set, the principal components. The corresponding eigenvalue therefore indicates how much variance of the data set is explained by the eigenvector. The higher this value, the more important the principal component is, as it contains a large part of the information in the data set.
Therefore, after calculating the eigenvalues, they are sorted by size and the eigenvalues with the highest values are selected. The corresponding eigenvectors are then calculated and used as principal components. This results in a dimensional reduction, as only the principal components are used to train the model instead of the individual features of the data set.
For a more detailed explanation of principal component analysis and an example of how to implement the algorithm in Python, take a look at our detailed article.
Factor Analysis
Factor analysis is another method that aims to reduce the number of dimensions in a data set. The aim here is to find latent, i.e. not directly observable, variables that explain the correlation between observable variables in a data set. These latent variables, which are referred to as factors, represent underlying dimensions that significantly simplify the data structure. This analysis is particularly widespread in the field of psychology, as there are many latent factors, such as “ability to work in a team” or “empathy”, which cannot be measured directly, but must be found out through observable questions, such as “Do you like working in groups?”.
To understand the methodology of factor analysis in more detail, let’s look at the following psychological personality test, which includes these statements:
- I enjoy talking to other people.
- I feel comfortable in large groups.
- I like meeting new people.
- I like working alone.
- I enjoy quiet environments.
We now want to break down these statements into as few latent factors as possible, which still explain a large part of the correlation between the variables. Assuming we obtain the following correlation matrix for our data set, which illustrates the pairwise correlations between the questions asked.
| Question 1 | Question 2 | Question 3 | Question 4 | Question 5 | |
| Question 1 | 1.00 | 0.80 | 0.75 | -0.40 | -0.50 |
| Question 2 | 0.80 | 1.00 | 0.85 | -0.30 | -0.40 |
| Question 3 | 0.75 | 0.85 | 1.00 | -0.35 | -0.45 |
| Question 4 | -0.40 | -0.30 | -0.35 | 1.00 | 0.70 |
| Question 5 | -0.50 | -0.40 | -0.45 | 0.70 | 1.00 |
From this correlation matrix, we can already see that there are two camps of questions, i.e. possibly two factors. Questions 1-3 all show a positive correlation with each other, while they show a negative correlation with questions 4 and 5. We can assign these questions to a common factor “sociability”. For questions 4 and 5, this behavior is exactly the opposite and they could be assigned to the factor “inversion”. To calculate reliable mathematical results for these assumptions, we go through the following steps of the factor analysis:
1. Calculation of Communality
With the help of the correlation matrix, we can determine the number of factors in the first step. To do this, we calculate the eigenvalues of the matrix, whereby there is exactly one eigenvalue for each variable. We obtain the following eigenvalues for our correlation matrix:
\(\)\[\lambda_1\approx\ 3.23;\ \lambda_2\approx\ 1.09;\ \lambda_3\approx\ 0.29;\ \lambda_4\approx\ 0.25;\ \lambda_5\approx0.14\]
According to the so-called Kaiser criterion, only the eigenvalues with a value greater than 1 are extracted as factors. According to this rule, we therefore obtain two factors, as assumed.
We can now determine the so-called factor loadings for these two factors, i.e. how high the correlation of the variables with a factor is. We need this characteristic value for further calculation of the commonality and we obtain it by forming a matrix with the two eigenvectors as column vectors and multiplying the first column by the root of the first eigenvalue and the second column by the root of the second eigenvalue. This gives us the following factor loading matrix:
\(\)\[E = \begin{bmatrix} 0.4906 & 0.6131 \\ 0.4815 & 0.3298 \\ 0.4859 & -0.1949 \\
-0.3561 & 0.6474 \\ -0.4058 & 0.2294 \end{bmatrix}\]
This matrix can then be used to calculate the commonalities, which indicate how much of the variance of a variable is represented by the two factors. To do this, the squared elements in each row are added up row by row.
For the first variable, for example, this results in:
\(\)\[h_1^2\ =\ \left(0.4906\right)^2\ +\ \left(0.6131\right)^2\ =\ 0.617 \]
This means that around 61% of the variance of the first variable is explained by the two factors. The remaining variance is lost due to the dimensionality reduction.
2. Rotation of the Factors
The rotation of the factors is an important step in the factor analysis in which the interpretability of the factors should be increased. The problem with the current result is that the linear combination of the five variables per factor is very difficult to visualize and interpret. The aim of the rotation is now to change the factor loadings so that each variable only loads as strongly as possible on one factor and as weakly as possible on the other factors. This makes the factors more clearly separable.
A frequently used algorithm for rotation is the so-called Varimax algorithm, which aims to rotate the factors in such a way that the variance of the loadings is maximized. As a result, each variable only loads very strongly on one factor, and interpretability is simplified. This results in the following rotation matrix:
\(\)\[
E_{\text{rot}} =
\begin{bmatrix}
0.778 & 0.110 \\
0.577 & -0.090 \\
0.220 & -0.475 \\
0.185 & 0.715 \\
-0.138 & 0.445 \\
\end{bmatrix}
\]
3. Interpretation of the Factors
Based on the rotated factor loadings, we recognize, as already assumed before the analysis, that the first three questions can be summarized under the first factor, which in the broadest sense measures the sociability of the respondent, i.e. the willingness and interest to interact with other people. The second factor, on the other hand, measures so-called introversion with questions 4 and 5, i.e. the preference for quiet and solitary activities.
Factor analysis and principal component analysis are often mistakenly associated with each other, as they both serve to reduce dimensions and have a similar approach. However, they are based on different assumptions and pursue different objectives. Factor analysis attempts to find latent, i.e. unobserved variables that explain the correlation between the variables. Principal component analysis attempts to reduce dimensionality by aiming to maximize variance.
As a result, the applications also differ significantly, as principal component analysis is primarily used for data visualization and clustering, i.e. as a first step for further analysis. Factor analysis, on the other hand, is used in areas in which latent structures are to be identified, such as psychology or intelligence research.
Cluster Analysis
Cluster analysis comprises various methods within the exploratory analysis that aim to assign the data points in a data set to a cluster or group so that all members of a group are as similar as possible to each other and as different as possible from the other groups. It is one of the unsupervised learning methods, as no predefined labels or categories need to be given. The k-means clustering is probably the most popular method for dividing the data set into k different groups.
An iterative attempt is made to find an optimal cluster assignment of k groups. The most important feature here is that the number of clusters must be determined in advance and is not determined during training. The letter k is representative of the required number of groups.
Once this number has been determined, the following steps are carried out as part of the algorithm:
- Selection of k: Before the algorithm can start, the number of clusters searched must be determined.
- Initialization: During initialization, k random data points are created. These serve as initial cluster centers and do not have to be part of the data set. The course of the clustering can depend significantly on the choice of initialization procedure, which is why we will deal with this in more detail at a later stage.
- Assignment of all data points to a cluster: All data points in the data set are assigned to the closest cluster center. The distance to all centers is calculated for each point and assigned to the group with the smallest distance.
- Update of the cluster centers: After all points have been assigned to a group, new centers are calculated for each cluster. For this purpose, all points of a group are summarized and the average of the characteristics is calculated. This results in k new or constant cluster centers.
- Repetition until convergence: Steps three and four are carried out until the cluster centers do not change or change only very little. This results in convergence and the assignment of data points to a group no longer changes.

For an even deeper insight into k-means clustering, we recommend our detailed article on this topic.
Structural-Testing Methods
The structure-testing methods within multivariate analysis examine given hypotheses and assumptions about a data set and provide concrete values for them. The methods differ primarily in how they model the relationship between variables.
Regression Analysis
Regressions are a central component in the field of multivariate analysis, which makes it possible to estimate the influence of several so-called independent variables on one or more so-called dependent variables. They are among the structure-testing methods, as it must be determined before the analysis which independent variables will be used to predict a dependent variable. Different methods have been developed over time, which differ in the underlying modeling.
Multiple Regression
Multiple regression is an extension of linear regression in which more than one independent variable is used to predict the dependent variable. With the help of the training data, an attempt is made to find the most meaningful values for the regression coefficients for the following equation, which in turn can then be used to make new predictions:
\(\)\[Y\ = \beta_0 + \beta_1X_1 + \ldots + \beta_pX_p + \varepsilon \]
Here are:
- \( Y \) is the dependent variable to be predicted.
- \( X_1, … , X_p\) are the independent variables whose values come from the data set.
- \( \beta_0 \) is the intercept, i.e. the intersection of the regression line with the y-axis.
- \( \beta_1, …, \beta_p \) are the regression coefficients, i.e. the influence that this independent variable has on the prediction of the dependent variable.
- \( \epsilon \) is the error term, which includes all influences that cannot be explained by the independent variables.
Using iterative training, an attempt is then made to find the regression coefficients that best predict the dependent variable. The Ordinary Least Squares method is often used as an error function for this purpose. A major challenge with multiple regression is the so-called multicollinearity, which can lead to the stability of the coefficients suffering. For this reason, extensive investigations into the correlation between the variables should be carried out before training.
Logistic Regression
Logistic regression is a special form of regression analysis that is used when the dependent variable, i.e. the variable to be predicted, can only assume a certain number of possible values. This variable is then also referred to as being nominally or ordinally scaled. Logistic regression provides us with the result of a probability with which the data set can be assigned to a class.
In linear regression, we have tried to predict a specific value for the dependent variable instead of calculating a probability with which the variable belongs to a specific class. For example, we have tried to determine the specific exam grade of a student depending on the hours the student has studied for the subject. The basis for estimating the model is the regression equation and, accordingly, the graph that results from it.
However, we now want to build a model that predicts the probability that a person will buy an e-bike, depending on their age. After interviewing a few test subjects, we get the following picture:
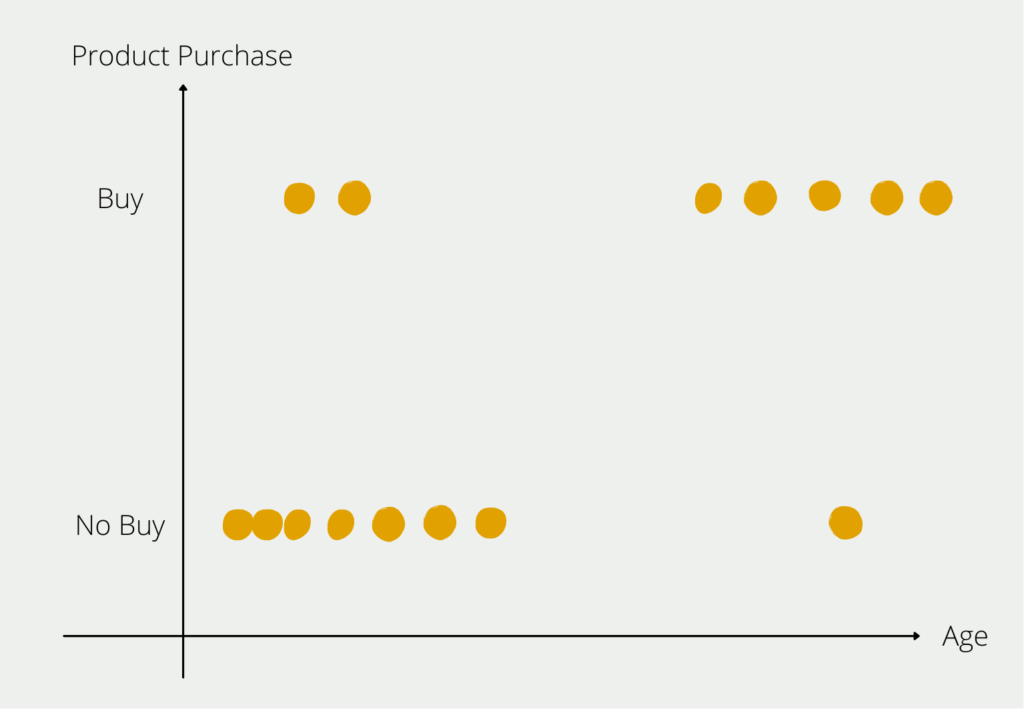
From our small group of respondents, we can see the distribution that young people for the most part have not bought an e-bike (bottom left in the diagram) and older people in particular are buying an e-bike (top right in the diagram). Of course, there are also outliers in both age groups, but the majority of respondents conform to the rule that the older you get, the more likely you are to buy an e-bike. We now want to prove this rule, which we have identified in the data, mathematically.
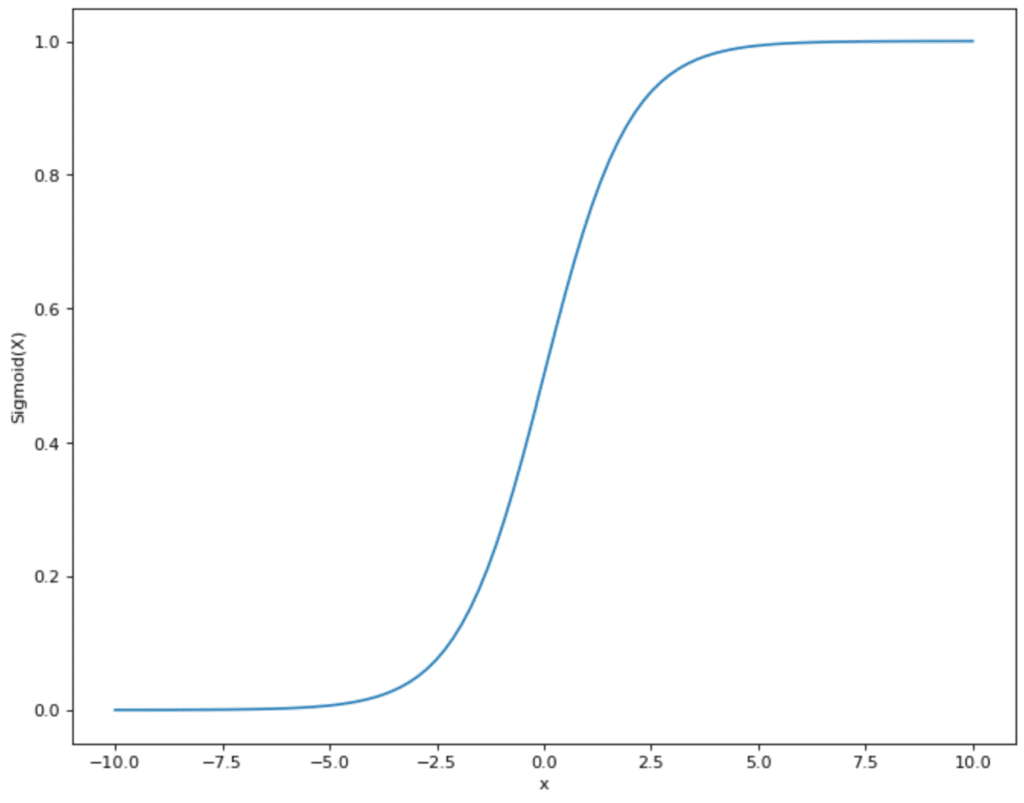
To do this, we need to find a function that is as close as possible to the distribution of points that we see in the diagram and also only assumes values between 0 and 1. This means that a linear function like the one we used for linear regression is already out of the question, as it lies in the range between -∞ and +∞. However, there is another mathematical function that meets our requirements: the sigmoid function.

The functional equation of the sigmoid graph is as follows:
\(\) \[S(x) = \frac{1}{1+e^{-x}}\]
For our example:
\(\) \[P(\text{Purchase E-Bike})) = \frac{1}{1+e^{-(a + b_1 \cdot \text{Age})}}\]
This gives us a function that returns the probability of buying an e-bike and uses the person’s age as a variable. The graph for our example would then look something like this:

In practice, you often do not see the notation that we have used. Instead, the function is rearranged so that the actual regression equation becomes clear:
\(\) \[logit(P(\text{Kauf E-Bike}) = a + b_1 \cdot \text{Alter}\]
Ridge and Lasso Regression
With a high number of independent variables, an increased risk of overfitting quickly arises, as the model has too many regression parameters and therefore the risk increases when it simply memorizes structures from the training data set. For this reason, the following two subtypes of regression have been developed, which already contain regularization methods that are intended to prevent overfitting.
L1 – Regularization (Lasso)
L1 regularization, or Lasso (Least Absolute Shrinkage and Selection Operator), aims to minimize the absolute sum of all network parameters. This means that the model is penalized if the size of the parameters increases too much. This procedure can result in individual model parameters being set to zero during L1 regularization, which means that certain features in the data set are no longer taken into account. This results in a smaller model with less complexity, which only includes the most important features for the prediction.
Mathematically speaking, another term is added to the cost function. In our example, we assume a loss function with a mean squared error, in which the average squared deviation between the actual value from the data set and the prediction is calculated. The smaller this deviation, the better the model is at making the most accurate predictions possible.
For a model with the mean squared error as the loss function and an L1 regularization, the following cost function results:
\(\) \[J\left(\theta\right)=\frac{1}{m}\sum_{i=1}^{m}\left(y_i-\widehat{y_i}\right)^2+\lambda\sum_{j=1}^{n}\left|\theta_j\right|\]
- \(J\) is the cost function.
- \(\lambda\) is the regularization parameter that determines how strongly the regularization influences the error of the model.
- \(\sum_{j=1}^{n}\left|\theta_j\right|\) is the sum of all parameters of the model.
The model aims to minimize this cost function. So if the sum of the parameters increases, the cost function increases and there is an incentive to counteract this. \(\lambda\) can assume any positive value (>= 0). A value close to 0 stands for a less strong regularization, while a large value stands for a strong regularization. With the help of cross-validation, for example, different models with different degrees of regularization can be tested to find the optimal balance depending on the data.
Advantages of L1 Regularization:
- Feature Selection: By incentivizing the model to not let the size of the parameters increase too much, a few of the parameters are also set equal to 0. This removes certain features from the data set and automatically selects the most important features.
- Simplicity: A model with fewer features is easier to understand and interpret.
Disadvantages of L1 Regularization:
- Problems with Correlated Variables: If several variables in the data set are correlated with each other, Lasso tends to keep only one of the variables and set the other correlated variables to zero. This can result in information being lost that would have been present in the other variables.
L2 – Regularization (Ridge)
L2 regularization attempts to counter the problem of Lasso, i.e. the removal of variables that still contain information, by using the square of the parameters as the regularization term. Thus, it adds a penalty to the model that is proportional to the square of the parameters. As a result, the parameters do not go completely to zero but merely become smaller. The closer a parameter gets to zero in mathematical terms, the smaller its squared influence on the cost function becomes. This is why the model concentrates on other parameters before eliminating a parameter close to zero.
Mathematically, the ridge regularization for a model with the mean squared error as the loss function looks as follows:
\(\)\[J\left(\theta\right)=\frac{1}{m}\sum{\left(i=1\right)^m\left(y_i-\widehat{y_i}\right)^2}+\lambda\sum_{j=1}^{n}{\theta_j^2}\]
The parameters are identical to the previous formula with the difference that it is not the absolute value (\theta) that is added up, but the square.
Advantages of L2 Regularization:
- Stabilization: Ridge regularization ensures that the parameters react much more stably to small changes in the training data.
- Handling of Multicollinearity: With several correlated variables, L2 regularization ensures that these are considered together and not just one variable is kept in the model while the others are thrown out.
Disadvantages of L2 Regularization:
- No Feature Selection: Because Ridge does not set the parameters to zero, all features from the data set are retained in the model, which makes it less interpretable as more variables are considered.
Artificial Neural Networks
Artificial neural networks (ANN) are powerful tools for modeling complex relationships in data sets with many variables. Here, too, it must first be defined which variable or variables are to be predicted and which are to be used as input for the prediction. This is why neural networks are also categorized as structure-testing methods. They are based on the biological structure of the human brain. They are used to model and solve difficult computer-based problems and mathematical calculations.
In our brain, the information received from the sensory organs is recorded in so-called neurons. These process the information and then pass on an output that leads to a reaction in the body. Information processing does not just take place in a single neuron but in a multi-layered network of nodes.
In the artificial neural network, this biological principle is simulated and expressed mathematically. The neuron (also known as a node or unit) processes one or more inputs and calculates a single output from them. Three steps are carried out:
1. The various inputs \(x\) are multiplied by a weighting factor \(w\):
\(\) \[x_1 \rightarrow x_1 \cdot w_1, x_2 \rightarrow x_2 \cdot w_2 \]
The weighting factors determine how important an input is for the neuron to be able to solve the problem. If an input is very important, the value for the factor \(w\) increases. An unimportant input has a value of 0.
2. All weighted inputs of the neuron are added up. In addition, a bias \(b\) is added:
\(\) \[(x_1 \cdot w_1) + (x_2 \cdot w_2) + b \]
3. The result is then entered into a so-called activation function.
\(\) \[y = f((x_1 \cdot w_1) + (x_2 \cdot w_2) + b) \]
Various activation functions can be used. In many cases, this is the sigmoid function. This takes values and displays them in the range between 0 and 1:
This has the advantage for the neural network that all values that come from step 2 are within a specified smaller range. The sigmoid function therefore restricts values that can theoretically lie between (- ∞, + ∞) and maps them in the range between (0,1).
Now that we have understood what functions a single neuron has and what the individual steps within the node are, we can now turn to the artificial neural network. This is simply a collection of these neurons organized in different layers.
The information passes through the network in different layers:
- Input Layer: this is where the inputs for the model are entered and processed in the neurons before being passed on to the next layer.
- Hidden Layer(s): One or more so-called hidden layers perform the actual information processing. The input from previous layers is weighted, processed in a neuron, and passed on to the next layer. This continues until the output layer is reached. As the calculations in this layer are not visible, but take place “hidden”, these collections of neurons are referred to as hidden layers.
- Output Layer: This layer follows on from the last hidden layer and takes over the outputs of the neurons. The results of the nodes in this layer contain the final result or decision of the neural network.
In the context of AI, it is often said that the models need to be trained and that a lot of data is required to deliver good results. But what exactly does this process mean for the artificial neural network?
From the data, the result is calculated for each data set that is produced when the network is run through and compared to see how good the result of the network is in comparison to the actual result from the data set. The aim is for the artificial neural network’s prediction to come ever closer to the actual result.
The neural network has an adjustment screw to bring the result closer to the actual outcome with each training step, namely the weighting of the outputs of the individual neurons. During the learning process, their weightings are constantly changed to alter the accuracy of the result. This means that each neuron decides which outputs of the previous neurons are important for its calculation and which are not. In the best-case scenario, this weight is consolidated with each new data set and the overall result becomes more accurate.
Here is a small example to illustrate this, which is of course not recommended for imitation. Three good friends are sitting next to you in math class. For every task that is calculated in class, you can ask all three of them to tell you their result because you are stuck yourself. All three of them are always happy to give you a number as a solution. Therefore, during the lessons (the training phase), you want to find out which of the three classmates usually has the best result.
For each task you calculate, you ask all three of them for their result and decide on one to compare it with the teacher’s result and find out which of the three classmates you can expect the best result from. Depending on the sub-area, you realize that one input is better than another. You therefore change the weightings in the training phase and refine them. In the exam, you will then ideally know exactly which of the three you need to turn to to get the correct result.
This is exactly what all neurons in the network do. During training, they are given a certain number of inputs, depending on how many neurons are “sitting” in the immediate vicinity. During training, they decide in each step which preliminary result is most suitable for them and then compare it with the actual result to determine whether they were correct. After the training, i.e. in the exam, they then know exactly which previous neurons are the most important.
What are the Advantages and Challenges of Multivariate Analysis?
The methods of multivariate analysis are powerful tools when working with large data sets and recognizing structures and correlations within them. Compared to univariate or bivariate analysis, it offers significantly more insight into the complex relationships within the data and thus creates a better understanding. However, the application of multivariate analysis also has some challenges, which we will discuss below.
The advantages of multivariate analysis include, for example:
- Better Understanding of Complex Relationships: By being able to analyze the relationships between multiple variables in more detail, even very complex relationships become quantifiable and apparent to researchers. These relationships are often not recognizable with simpler methods.
- Recognition of Latent Variables: Different multivariate methods can be used to identify so-called latent variables. These are not directly measurable constructs that can be derived from the observed data, such as empathy in psychology. Factor analysis can be used for this purpose, for example.
- Efficient Use of Data: By including several variables in the simultaneous analysis, the entire data set and the information it contains is better utilized and all recognizable structures are revealed.
In addition to these advantages, the use of multivariate methods also has some challenges that should be taken into account during implementation:
- High Model Complexity: The construction of multivariate models is often complex and requires a deep understanding of the underlying statistics in order to achieve optimal results. In addition, models that include several variables are also more difficult to interpret and validate, meaning that more work needs to go into these steps to achieve usable results.
- Data Quality Requirements: Data quality plays an even more important role in such complex methods to achieve reliable results. It must be ensured that the data set is complete, i.e. that there are no missing values, and that it is consistent, i.e. that it does not contain any incorrect values that could negatively influence the results. In addition, some methods, such as PCA, require the data to be standardized so that no erroneous dominant effects arise that are merely attributable to different scales.
- Intercorrelations: If the independent variables correlate strongly with each other, i.e. there is so-called multicollinearity in the data set, the stability and interpretability of the model can suffer as a result. These correlations must therefore be detected at an early stage and possibly only one of the correlated variables should remain in the data set.
- Overfitting: Due to the increasing number of variables Overfitting: The increasing number of variables and the higher model complexity also increase the risk of overfitting, i.e. the model memorizing specific properties of the data set and no longer concentrating on recognizing the basic structures. This leads to the model only providing poor predictions for new data.
- Computational Intensity: Many of the models presented are very computationally intensive, especially with large data sets, which means that not only do longer training times have to be accepted but more specialized hardware, such as graphics cards, may also be required.
Multivariate analysis offers many advantages when working with complex data sets and creating meaningful models. However, these also have to contend with some challenges, as more computing resources are required, for example, and the data quality must be very high to be able to make reliable predictions.
This is what you should take with you
- Multivariate analysis comprises methods that are designed to identify and quantify the relationship between several variables.
- Multivariate analyses are divided into structure-checking methods, which use a hypothesis as a basis, and structure-discovering methods, which recognize correlations completely independently.
- Multivariate analyses have the advantage that they can also recognize latent variables that are not directly present in the data set and also use the data set more efficiently, as all information and its correlations can be mapped.
- In this article, we have presented various multivariate analysis methods, such as artificial neural networks or principal component analysis.

What is a Nash Equilibrium?
Unlocking strategic decision-making: Explore Nash Equilibrium's impact across disciplines. Dive into game theory's core in this article.

What is ANOVA?
Unlocking Data Insights: Discover the Power of ANOVA for Effective Statistical Analysis. Learn, Apply, and Optimize with our Guide!

What is the Bernoulli Distribution?
Explore Bernoulli Distribution: Basics, Calculations, Applications. Understand its role in probability and binary outcome modeling.

What is a Probability Distribution?
Unlock the power of probability distributions in statistics. Learn about types, applications, and key concepts for data analysis.

What is the F-Statistic?
Explore the F-statistic: Its Meaning, Calculation, and Applications in Statistics. Learn to Assess Group Differences.

What is Gibbs Sampling?
Explore Gibbs sampling: Learn its applications, implementation, and how it's used in real-world data analysis.
Other Articles on the Topic of Multivariate Analysis
You can find an interesting article about Multivariate Analysis and other types on Medium.

Niklas Lang
I have been working as a machine learning engineer and software developer since 2020 and am passionate about the world of data, algorithms and software development. In addition to my work in the field, I teach at several German universities, including the IU International University of Applied Sciences and the Baden-Württemberg Cooperative State University, in the fields of data science, mathematics and business analytics.
My goal is to present complex topics such as statistics and machine learning in a way that makes them not only understandable, but also exciting and tangible. I combine practical experience from industry with sound theoretical foundations to prepare my students in the best possible way for the challenges of the data world.